80 F. high in St. Cloud Friday.
77 F. average high on August 28.
76 F. high on August 28, 2014.
Trace of rain fell at MSP International Airport yesterday. No rain at St. Cloud
August 28, 1989: Baseball-sized hail pummels Pequot Lakes.
My Outsourced MemoryMy
name is Paul. At least that's the name that comes up on my iPhone. I
seem to have forgotten key memories; I think I left them back in the
70s. Memorization, problem-solving, even common sense is now optional,
so long as you have a shiny smartphone in your pocket.
All I have
to do is ask Ms. Siri or Mr. Google! Directions? There's an app for
that. My Audible app will even read to me. Because reading is hard! A
moment isn't real until I snap a photo or capture video. I'm in a
perpetual digital daze.
The 21st century looked so promising. I'm
still waiting on my flying car and a robot-butler that looks like
Jennifer Anniston. In the meantime I have a powerful supercomputer in my
pocket to pass the time. If that goes away I'm in big, big trouble.
Floridians
may be suffering from amnesia: no hurricanes in nearly a decade. It now
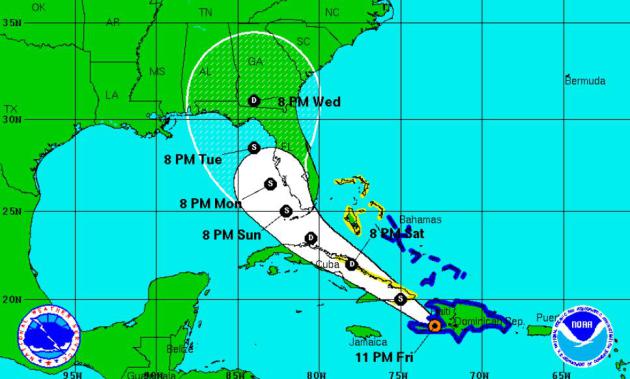
it appears "Erika" will remain a tropical storm, flooding Florida with
up to 10 inches of rain next week. The ECMWF model had the right idea
weakening the storm yesterday.
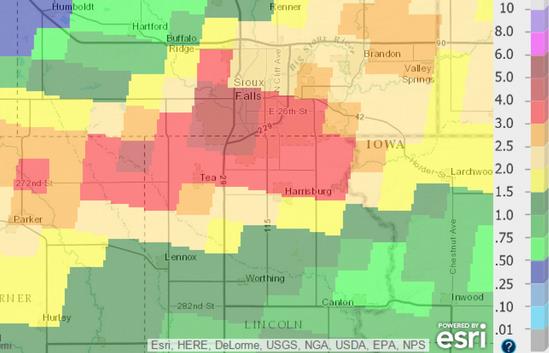
The storm that flooded Sioux Falls
with 4-8 inches in one hour (!) is drifting away; skies clear today with
85-90F degree heat every single day next week.
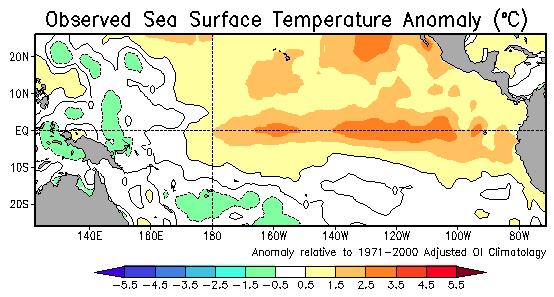
Summer's last gasp? With a Super El Nino in the Pacific I expect spurts of sweaty weather into October.
Astonishing 4-8" of Rain In One Hour Floods Sioux Falls, South Dakota.
The rain is falling harder now during the warm season. Not everywhere,
certainly not simultaneously, but when it does rain it often comes down
with much greater intensity. Warming has boosted water vapor levels by
7-10% (roughly 7% for every 1C of warming) so there's more moisture
available to fuel intense thunderstorms. This was a train-echo
phenomenon, but it doesn't change the fact that more moisture was
available to create jaw-dropping rainfall rates; here's an excerpt from
Capital Weather Gang: "
A deluge of epic proportions swamped portions of Sioux Falls, South Dakota Thursday evening. Jay Trobec, the chief meteorologist for Keloland TV
out of Sioux Falls, said thunderstorms unloaded up to 4-8 inches of
rain in less than an hour. The torrential downpours blocked
intersections and boats were dispatched on busy streets to
assist stranded motorists. The Associated Press reports that Sioux Falls’ mayor, Mike Huether, called it a “100-year rain...”
Image credit above: "
Doppler
radar estimated rainfall totals around Sioux Falls, S.D. August 27,
2015. Note that radars often underestimate totals in extreme events like
this." (NWS).
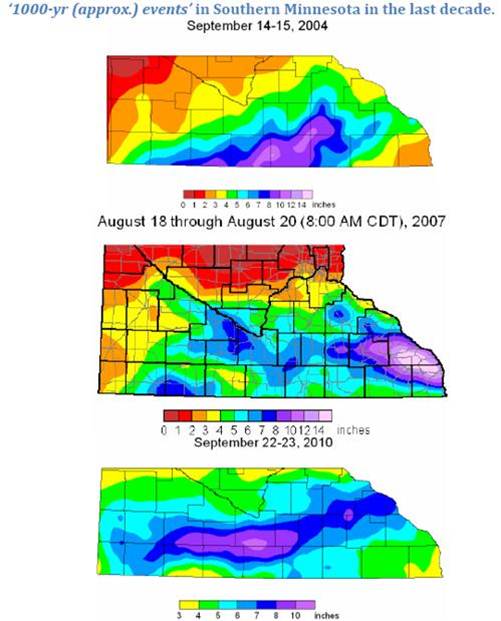
1,000 Year Minnesota Flash Flood Events Since 2004. The Minnesota Climate Office and Minnesota DNR
counts at least three 1-in-1,000 year events in southern Minnesota in
the last 11 years. Extreme flooding in Duluth in 2012 may have been
another 500 to 1,000 year event. Fluke or trend?
Hurricane Risk Diminishes.
There may be too much wind shear for Erika to strengthen to hurricane
strength, but that doesn't mean the flooding threat has dissipated. Some
of the worst flooding events have taken place with weak, slow-moving
tropical depressions and tropical storms, still capable of 10"+ rains.
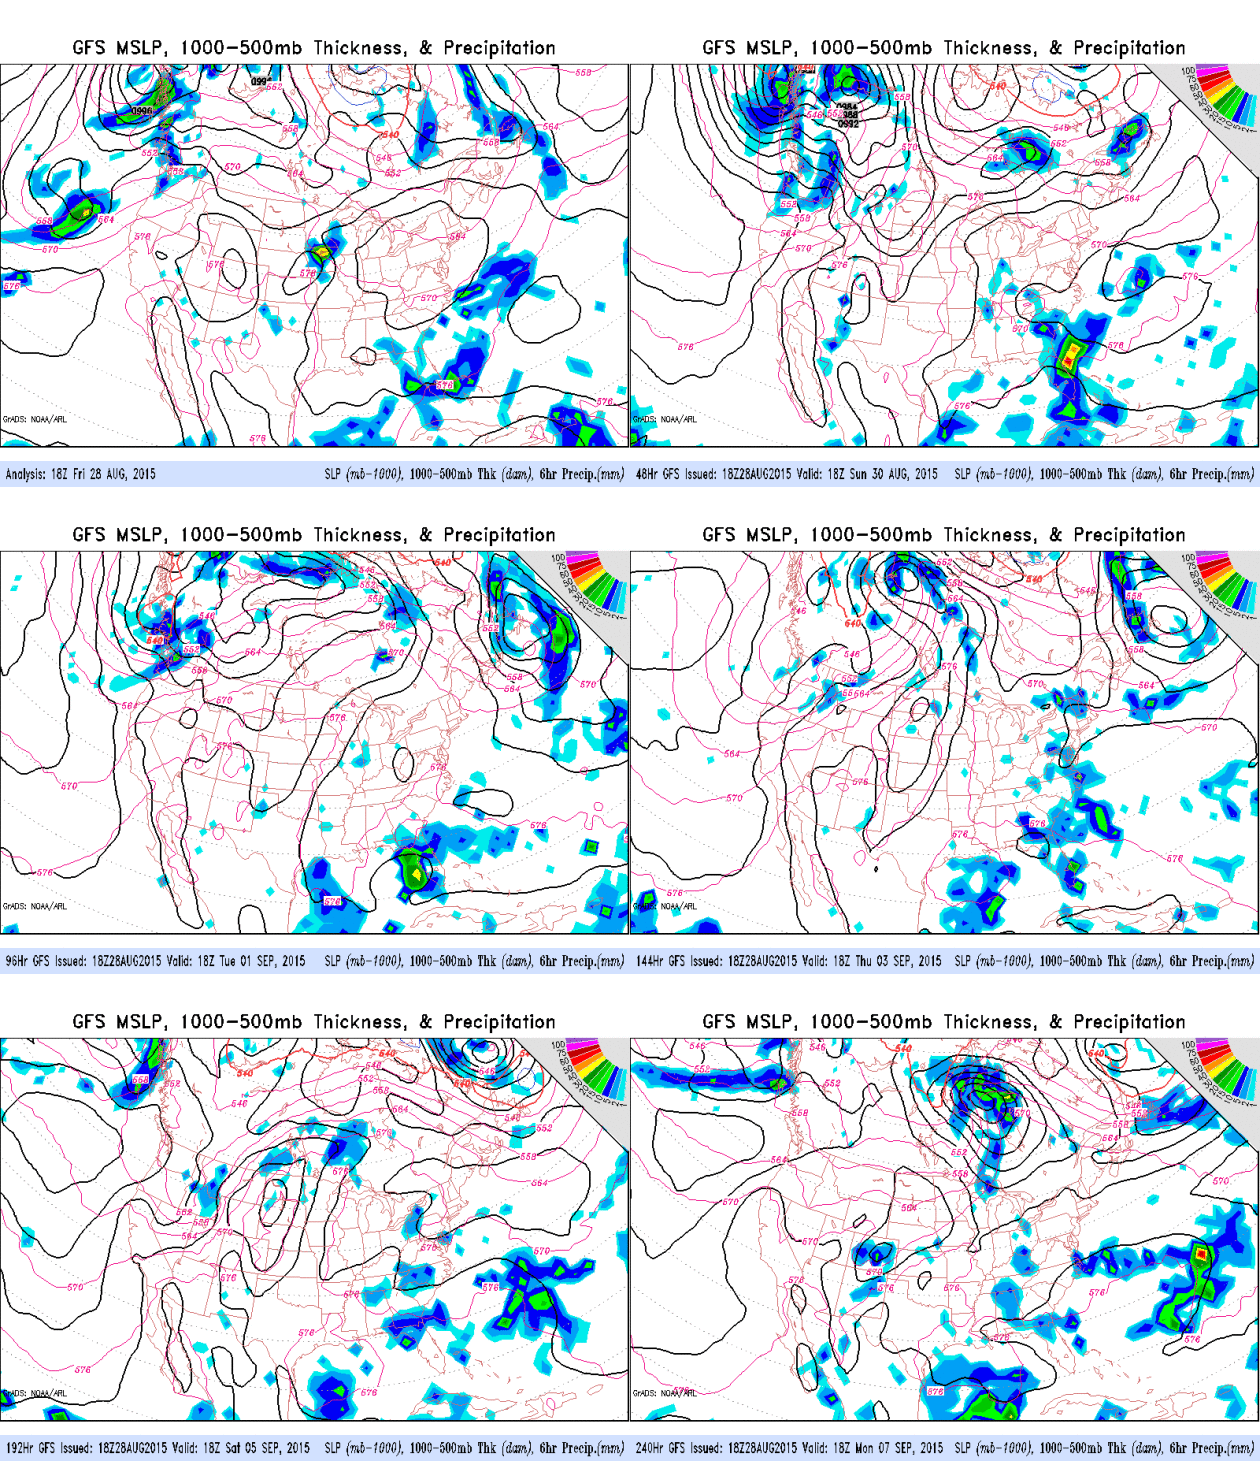
10-Day GFS Outlook.
Now the GFS shows a weakened "Erika" pushing into Florida by Monday,
where it's forecast to stall over the eastern Gulf of Mexico, possibly
resulting in excessive rainfall amounts for Florida and portions of the
southeastern USA. A hot week is brewing for Minnesota, with little
chance of free, Canadian A/C until after September 7. Source: NOAA.
Southeast Soaking.
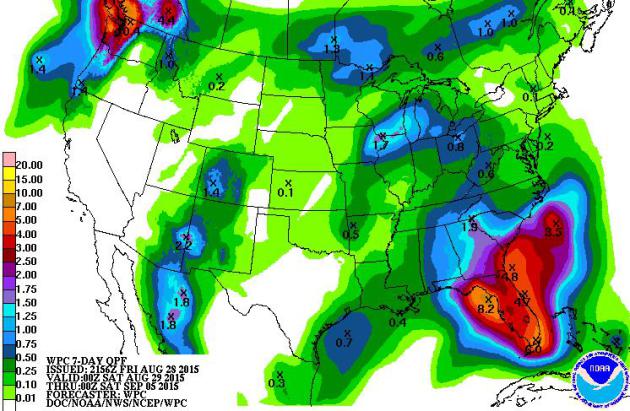
7-Day NOAA model ensembles print out some 6-8" amounts for Florida, but
this may be light; if the soggy remnants of "Erika" do in fact stall
near Florida some 10"+ amounts are possible, creating favorable
conditions for extensive flash flooding.
 A Very Wet Week for Florida.
Friday night's 00z run of the 12 KM NAM model shows a plume of 5-7"
rains from Miami and Orlando to near Jacksonville; locally heavier
amounts are possible. Source: WeatherBell.
What September?
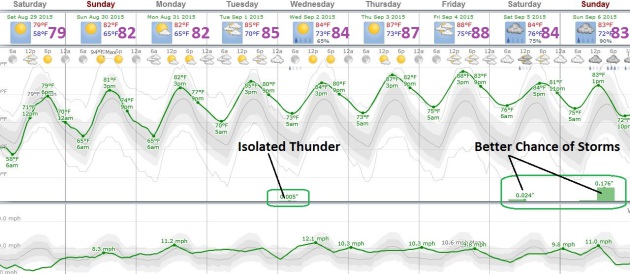
The first week of September will look and feel more like mid-July, with
a streak of daytime highs ranging from 85-90F. An isolated
thundershower is possible Wednesday, but most towns and farms won't see
significant rains from scattered T-storms until next weekend. Source:
Weatherspark.
Extended Outlook: Odds Favor a Milder Fall.
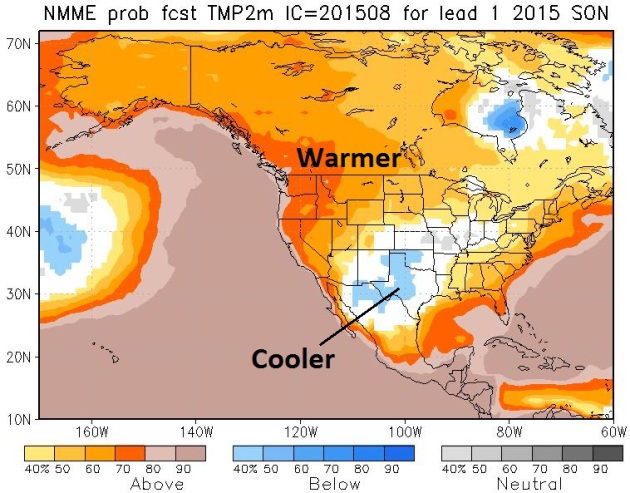
Thank (or blame) a Super El Nino for what appears to be a mild bias for
much of the USA into November. The only exception: the southern Plains,
where El Nino may energize the southern branch of the jet stream,
resulting in cooler, wetter weather for parts of the southern USA.
Source: NOAA Climate Prediction Center.
Unusually Windy for August. Here's the intro to this week's weather update from Dr. Mark Seeley at
Minnesota WeatherTalk: "
For
many parts of Minnesota last Saturday through Monday (August 22-24) was
the windiest 3-day period this summer, as well as the windiest period
since mid-April. Average wind speeds for all hours ranged from 15-20
mph, and peak gusts each day ranged from 35 to 45 mph around the state.
From the stand point of normal climate conditions for August, this was a
highly unusual period fueled by the passage of a strong low pressure
system across the state and into Canada, a pattern more commonly seen in
the late autumn period..."
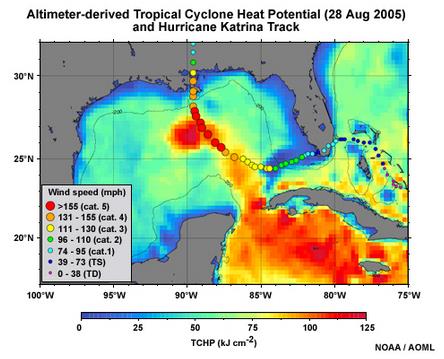
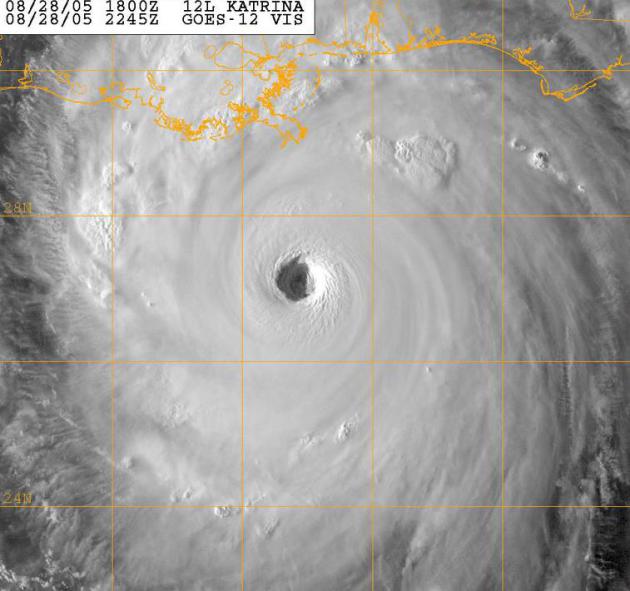
10 Years After Katrina: The Science Behind The Most Damaging Hurricane in U.S. History. Tropical weather expert Brian McNoldy has a very good explanation at
Capital Weather Gang; here's an excerpt: "...
The
very warm ocean eddy that Katrina tracked over in the central Gulf was
associated with the Loop Current which transports warm Caribbean water
northward towards the Gulf of Mexico and Florida Keys. As you can see
from the track, it intensified as it passed over the high ocean heat
content region, and began to weaken once it exited that region. Vertical
shear was quite low throughout Katrina’s lifetime. On August 28, when
Katrina was at its peak intensity, vertical shear throughout most of the
Gulf of Mexico was below 12 mph (10 knots)..."
Katrina Landfall.
NOAA NCDC
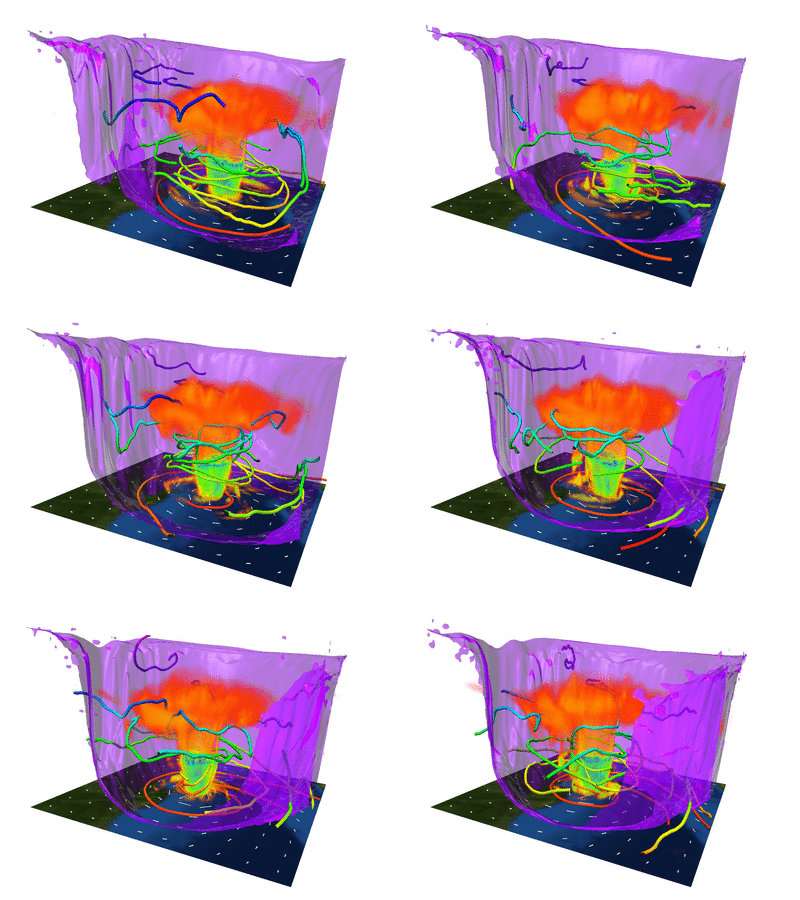
has a great animation of the dynamics involved with Hurricane Katrina
as it made landfall; here's an explainer of the graphic above: "
A
3-D animated image of downscaled Global Forecast System (GFS) model data
showing Hurricane Katrina making landfall on August 29, 2005. This
image was generated with the Visualization and Analysis Platform for
Ocean, Atmosphere, and Solar Researchers (VAPOR) tool and ImageMagick."
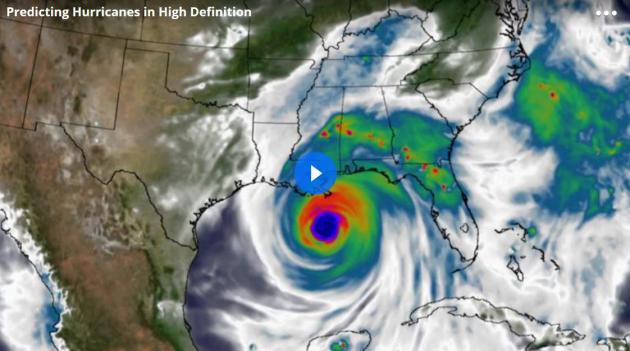
Hurricane Models Have Gotten Way Better Since Katrina.
But they'll never be perfect, and predicting tropical cyclone intensity
days in advance is still problematic. Here's a clip from
WIRED: "...
Where
did these improvements come from? The first is data—more of it and
better integrated in models. NASA has launched satellites such as the
Global Precipitation Measurement Mission. (Another powerful weather
satellite is launching next fall.) Field campaigns, in which planes drop sensors into hurricanes, have gathered valuable data, too..."
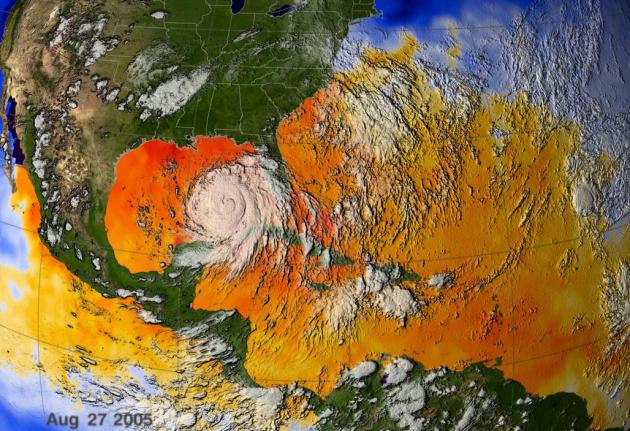
10 Years Later: Was Warming To Blame for Katrina?
Water temperatures in the Gulf of Mexico were close to 90F as Katrina
came ashore, adding additional fuel to the hurricane's massive
heat-engine. But was it triggered by warming? Here's an excerpt from
Climate Central: "...
Unlike
temperature records, which tend to extend back long enough to show how
the odds of heat waves have changed over time — and whether those
changes are beyond the normal chaotic ups and downs of nature — reliable
hurricane records extend back at most a few decades to the beginning of
satellite observations. That isn’t long enough for scientists to say
with confidence that any changes to hurricane frequency or intensity
over that time aren’t from natural variability alone. In fact, some work
has shown that any expected trends in increased hurricane intensity may
not be detectable for several decades..." (Image credit: NASA).
Florida Is Nearing 10 Years With No Hurricanes. Here's an excerpt of a timely overview on Florida's unusual hurricane drought, courtesy of
The Weather Channel: "...
Prior to this long period with no hurricanes in Florida, Charley, Frances, Jeanne and Ivan pounded the state in 2004. This was followed by Dennis, Katrina and Wilma in the historic 2005 hurricane season. Rita passed
south of the Florida Keys that year, but did produce significant storm
surge flooding in Key West. Wilma was also the last major hurricane (Category 3 or stronger on the Saffir-Simpson Hurricane Wind Scale) to make landfall in the United States. According to Dr. Phil Klotzbach of Colorado State University and blogger for wunderground.com, this year's Hurricane Danny
was the 26th straight Atlantic major hurricane to not impact the United
States. The odds of that happening are about 1 in 7,400 based on the
1900-2000 rate of 29 percent of all major hurricanes impacting U.S., Klotzbach said...." (Image credit: NASA).
These Are The Cities Most Vulnerable To The Next Katrina.
TIME has the story - here's a clip: "...
But,
while New Orleans still has much work to do to prepare fully for the
next storm, in some ways the storm has been a helpful reminder—albeit a
painful one. For other regions that haven’t prepared, the next storm
could only be a season away. According to RMS, three cities beyond New
Orleans face especially high chances of large-scale damages: Miami,
Tampa and New York City. Currently, Tampa faces a 1-in-80 annual chance
of a storm surge event causing more than $15 billion in damage. The odds
are 1-in-125 in Miami and 1-in-200 in New York City..." (Map credit: Climate Central).
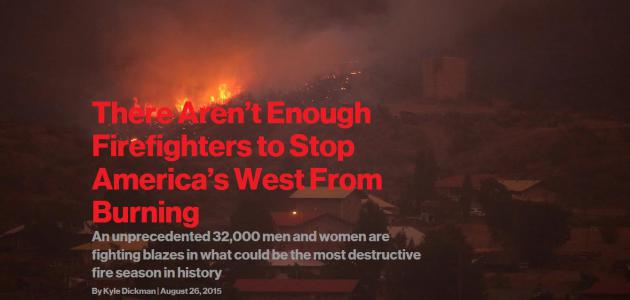
There Aren't Enough Firefighters To Stop America's West From Burning. Here's a snippet from Bloomberg Business that got my full attention: "...Accounting
for insurance costs, damages to businesses and infrastructure, and the
flash floods and mudslides caused by denuded slopes, this year’s fires
will likely cost taxpayers $25 billion—and that’s if a whole town or
city doesn’t burn, which is a distinct possibility. If that happens,
according to a report by the Natural Resources Defense Council, the
costs could double or triple: One hundred forty million Americans live
in fire-prone regions, and $237 billion in property sits in those
high-risk areas. The Forest Service, the country’s largest wildland
firefighting agency, has spent $800 million trying to control the flames
this year, and it’s only August..."
Drought-Plagued California Readies For El Nino Storms. But will they come? Here's an excerpt from
The Los Angeles Times: "...
While
the warming of Pacific Ocean waters tends to bring heavy winter rain to
California and much of the southern and eastern U.S., California's
state climatologist noted only half the time when there have been big El
Ninos has there been meaningful, heavy rains. California would need 1 ½
times its normal rainfall to get out of the extended drought, which is
unlikely, according to Mike Halpert, deputy director of the National
Oceanic Atmospheric Administration's Climate Prediction Center.
Emergency planners said the prolonged dry conditions across the state
could lead to more debris, fallen trees and flooding during early rains..." (Image:
NOAA NCEP).
China Air Pollution: Beijing Records Its Cleanest Air Ever. They had to shut down industries to achieve this milestone, but it's a step in the right direction. Here's a clip from
Energydesk: "...
Ahead
of the city’s grand celebration on the 70th anniversary of the end of
World War II, the state both shut down industrial facilities in the
region and cut down on car emissions — all because it wants the sky to
be ‘Parade Blue’ on September 3. This has led to five straight days in
which PM2.5 concentration (the go-to pollution particulate) has been
better than the 35 mg/m³ national air quality standard, according to
data from Beijing Municipal Environmental Protection Monitoring Centre
(BMEMC)..."
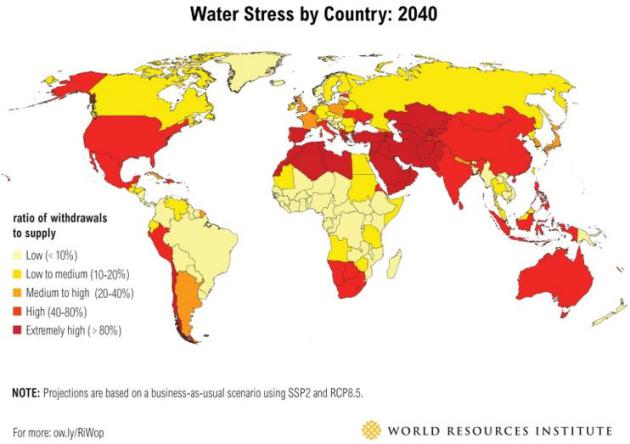
These Nations Are About To Start Running Out of Water. What can possibly go wrong?
VICE News has the story - here's an excerpt: "...
The
study ranked all countries according to the severity of the water
crisis they are estimated to face, and the Middle East stood out as the
most vulnerable region. Fourteen of the 33 countries most likely to
suffer water shortfalls are in the region, including nine that are
considered extremely susceptible: Bahrain, Kuwait, Palestine, Qatar, the
United Arab Emirates, Israel, Saudi Arabia, Oman, and Lebanon. "The
region, already arguably the least water-secure in the world, draws
heavily upon groundwater and desalinated seawater, and faces exceptional
water-related challenges for the foreseeable future," says the report..." (Photo credit: Yahya Arhab/EPA).
Ranking The World's Most Water-Stressed Countries.
World Resources Institute has the research referenced in the story above; more perspective and details: "...
Using an ensemble of climate models and socioeconomic scenarios,
WRI scored and ranked future water stress—a measure of competition and
depletion of surface water—in 167 countries by 2020, 2030, and 2040. We
found that 33 countries face extremely high water stress in 2040 (see the full list).
We also found that Chile, Estonia, Namibia, and Botswana could face an
especially significant increase in water stress by 2040. This means that
businesses, farms, and communities in these countries in particular may
be more vulnerable to scarcity than they are today..."
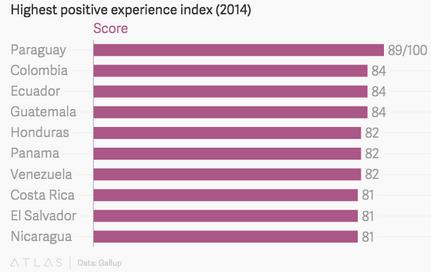
The Happiest (And Least Happy) Countries In The World, Ranked. What is going on in Central America? They're at the top of the list. Here's the intro to a story at
Quartz: "
As it turns out, humanity is pretty happy. That’s according to the latest Global Emotions report
by polling company Gallup, which interviewed more than 150,000 adults
in 148 countries in 2014 about their emotions and wellbeing. Asking
questions such as “did you smile or laugh yesterday” or “did you learn
or do something interesting yesterday?” the survey rated positive
emotions on a scale from 0 to 100, and was able to rank countries
according to a “positive experience index...”
TODAY: Warm sunshine, hints of smoke in the air. Winds: SE 5-10. High: 81
SATURDAY NIGHT: Clear and mild. Low: 63
SUNDAY: Sunny, bordering on hot. Dew point: 67. High: 87
MONDAY: Steamy sun, stinking hot. Wake-up: 68. High: 90
TUESDAY: Still sticky, isolated T-storm possible. Wake-up: 70. High: 88
WEDNESDAY: Partly sunny, mostly humid. Dew point: 70. Wake-up: 69. High: 86
THURSDAY: Dog Days of September. Stuffy. Wake-up: 68. High: 88
FRIDAY: Escape to the lake. Feels like July. Wake-up: 70. High: near 90
Climate Stories....
There Is Still Scientific Research That Says Man-Made Climate Change is a Myth. Here Is Why It's Wrong. But I read it on the Inter-web - it must be right!
Quartz has an explanation of the methadology used to shoot down some of the favorite conspiracy theories: "...
To
see if there is indeed such a possibility, Rasmus Benestad of the
Norwegian Meteorology Institute and his colleagues set out to replicate
the results from the tiny sliver of studies that believe humans are not
responsible for climate change. Their results, published in Theoretical and Applied Climatology,
show that all of the chosen 38 studies had some, often serious
methodological flaws. If these contrarian studies are corrected, their
new conclusions would probably end up agreeing with the consensus—or be
inconclusive..."

Why Climate Change Could Make Hurricane Impact Worse.
Sea level rise magnifies storm surge damage and the amount of land
impacted by extreme coastal flooding. But that's only part of the story;
here's an excerpt from
TIME: "...
While
scientists have come to a consensus about how storm surge will affect
cities, research on how climate change affects hurricane strength and
intensity remains unclear, and no findings have been positive. Many
peer-reviewed studies suggest that warmer weather in tropical oceans has
increased the frequency
of tropical storm activity, though not necessarily the intensity.
Others suggest that climate change has made storms more intense. Still other research has suggested that future storms will be both more frequent and more intense..."
New Orleans' Greatest Threat is Climate Change Plus The "Loop Current" Plus a Future Katrina. ThinkProgress takes a look at how future warming of the atmosphere and oceans may impact hurricanes in the future; here's an excerpt: "...
While
most stories making this point tend to focus on sea level rise, I’m
going to look at the role of the “Loop Current” — and why Hurricane
Katrina (and Gustav) weren’t as strong and hence as devastating at
landfall as they could have been. The key point: All things being equal,
if a storm taking the same track of Katrina (or Gustav) occurred in
2050, then, rather than weakening before making landfall, it will
probably strengthen considerably, creating far more havoc. To understand
why, let’s first answer the question — How did Katrina turn into a
powerful Category Five hurricane so rapidly?.."
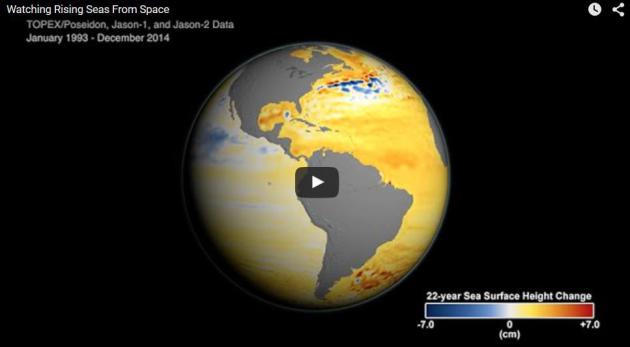
New NASA Videos Show Stark Ice Loss From Earth's Ice Sheets.
The Carbon Brief delves into the latest findings from NASA; here's a clip: "
The
US space agency, NASA, yesterday released brand new images showing the
pace of ice loss from Earth's two vast ice sheets, Greenland and
Antarctica. The amount of ice lost from the frozen
expanses at the very north and south of the planet is accelerating, say
the scientists, and together have helped raise global sea level by more
than 7cm since 1992..."
NASA Science Zeros In On Sea Level Rise. How Much? How Soon? Here's a clip from a good summary, courtesy of
NASA: "...
East
Antarctica’s massive ice sheet remains the primary unknown in sea level
rise projections. Though it appears to be stable, a recent study found
under a major glacier two deep troughs that could draw warm ocean water
to the base of the glacier, causing it to melt. “The prevailing view
among specialists has been that East Antarctica is stable, but we don’t
really know,” said glaciologist Eric Rignot of the University of
California Irvine and JPL. “Some of the signs we see in the satellite
data right now are red flags that these glaciers might not be as stable
as we once thought. There’s always a lot of attention on the changes we
see now, but as scientists our priority needs to be on what the changes
could be tomorrow...”
Animation credit above: "
This
video describes the causes of sea level rise and how sea level has
changed over the last two decades as observed by the Jason series of
satellite missions." Credits: NASA/JPL.
Farmers On Four Continents Tell Their Climate Change Stories. RTCC.org has the stories; here's the introduction: "
Whether
it is deciding when to plant crops or where to graze livestock, farmers
constantly have an eye on the sky. As greenhouse gases warm up the
planet, they are on the front line of shifting weather patterns. It is
one thing to look at climate models, but what do farmers experience on
the ground?...






.jpg)


No comments:
Post a Comment