5.5" fell on March 23, setting a new record for the date (old record was 5.4" in 1991).
7.1" snow total from this storm (March 22 and 23).
12.7" snow so far in March (average snowfall as of March 23 is 6.9")
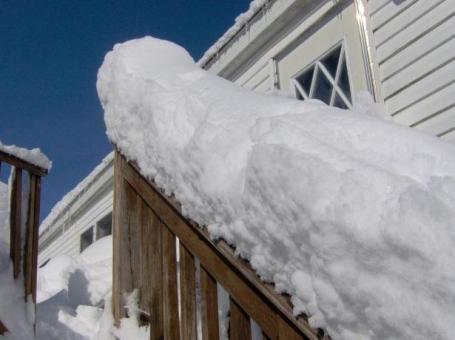
7" on the ground as of Wednesday evening.
5th snowiest winter season on record in the Twin Cities.
1983-84 the last winter MSP had more snow than they're having this winter.
1.26" precipitation fell on St. Cloud from March 22-23 (rain, ice and melted snow).
3.63" precipitation since January 1 (average is 2.37" in St. Cloud).
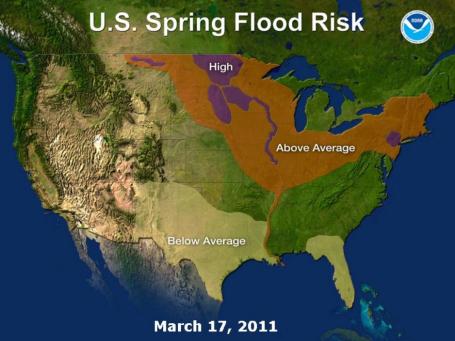
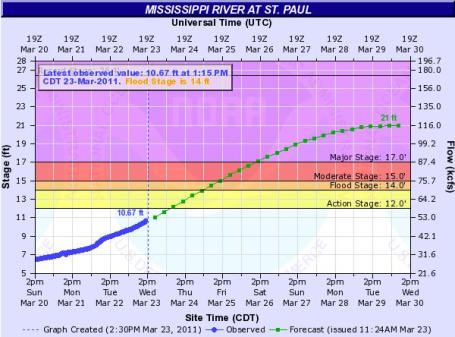
March 29-30 (next Tuesday/Wednesday): projected NOAA crest of the Mississippi River in St. Paul (4 feet above major flood stage). Details below.
56 F. predicted high in St. Cloud on Sunday, April 3.
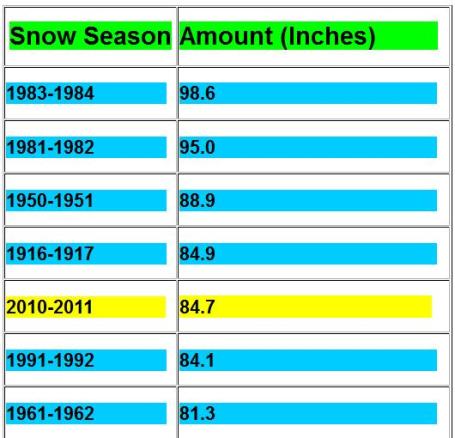
May You Live In Interesting Times. An update from the local NWS office: "2010-2011 Winter Currently Ranks 5th Snowiest Of All Time For the Twin Cities. O.K. Maybe not for "all time" (who knows what was happening in 573 AD?) but since reliable modern-day records were started in 1891. "Another 4.5" of snow fell on the Minneapolis/St. Paul International Airport March 22 into the 23rd, pushing the seasonabl snowfall total past the 1991-1992 seasonal total and into 5th place on the all-time list. The 2010-2011 snow season is now the snowiest season since the record was set during the 1983-1984 season. The current seasonal snowfall total stands at 84.6". The average seasonal snowfall in the Twin Cities is 55.9 inches."
Snow Trivia. 7.1" snow has fallen with this storm as of 1 PM at the Reformatory (the official site in STC, which is very close to the airport), 5.5" of that after midnight today (which breaks the former record for the day of 5.4" set in 1991). This brings the monthly snowfall to 12.7". This should also bring the seasonal total to 63.9". The 10th snowiest winter on record, according to Professor Bob Weisman at St. Cloud State University, is 64.9" in 1993-1994 (http://web.stcloudstate.edu/raweisman/climate/snowtop10.html).
This is NOT the snowiest storm for the STC area this winter -- that distinction goes to the President's Day Storm, which left 8.5" in town and did not delay St. Cloud State, unlike this one which delayed classes 2 hours. Area school districts were out of school today due to the storm. They had the day off on Presidents Day for the holiday.
We've had a lot of 5 inches this year, but only this storm, and the Presidents Day storm broke the 6" total, from what I can find.
Thanks to meteorologist D.J. Kayser for passing on this information.
More interesting weather factoids from SCSU Meteorology Professor Bob Weisman:
"Both yesterday and today have measurable snowfall, so we now have had 46 days with measurable snowfall. That's the 16th highest total of days with at least 0.1 inch and the most since 1995-1996 (47 days). The most was 60 days in 1950-1951." "After taking a direct hit from this storm, we will continue the seemingly never ending streak of seeing snow on the ground. Today marks St. Cloud's 121st consecutive day with at least an inch of snow on the ground. There have been 16 seasons in which that streak was at least 120 days long (that's 4 months....oy!), the most recent being 2001-2002 (146 days, the most ever) and 1996-1997 (133 days). Both of those years produced major flooding in our area and record or near record flooding along the Minnesota and Red Rivers. Note that the last consecutive day with a snow cover is not the same as the last possible day of snow cover. Frequently, St. Cloud gets snow in late March and April. The average snowfall in April is 2.9 inches. The average last day with at least an inch of snow cover is April 4."
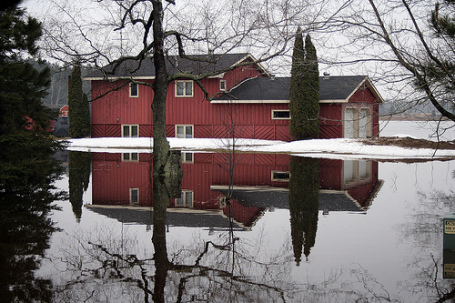
Latest on the Sauk River: http://water.weather.gov/ahps2/hydrograph.php?wfo=mpx&gage=stcm5&view=1,1,1,1,1,1,1,1%22 -- Drove by it this evening and it certainly is rising, a few trees right along the bank are now underwater.
Latest on the Mighty Mississippi River: http://water.weather.gov/ahps2/hydrograph.php?wfo=mpx&gage=scom5&view=1,1,1,1,1,1,1,1%22
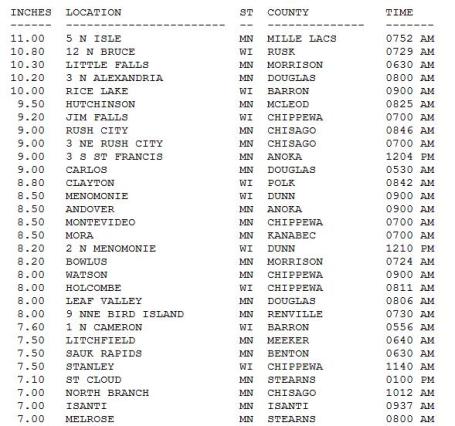
Snowfall Totals:
14.5" Hayward, WI
11.5" Osceola, WI
10" Rush City
9" Cambridge
9" Francis (Anoka county)
8.7" Brainerd
7.5" Breezy Point
7.1" St. Cloud
6" St. Paul
4.6" Chanhassen
* For a complete recap of snow totals from the local Chanhassen National Weather Service click here.

Sauk River at St. Cloud. Right now the NWS hydrologists are predicting that the Sauk River will crest by the weekend some 5-6" below flood stage. People living near the river should stay alert - these crest forecasts may be adjusted (upward), in response to our recent heavy rain/snow. Check the latest numbers here.
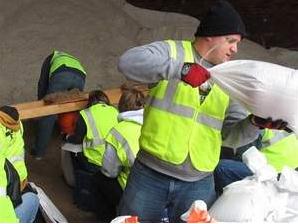
Davenport (Iowa) Could See Flooding To Rival 1993 Record. An update from the Des Moines Register:
"Volunteers in Davenport are filling thousands of sandbags, workers are rushing to protect the city's signature minor league baseball park, and the mayor is warning residents of one neighborhood to be ready to leave if necessary as the city braces for a potentially historic flood. Officials in Davenport, an eastern Iowa city of 100,000 residents that hugs the Mississippi River, say the water level in coming weeks could surpass the 22.63-foot record crest in 1993, which closed downtown businesses and streets for weeks and forced the evacuation of hundreds of residents. Davenport is the largest metropolitan area along the upper Mississippi without a flood wall, partly because officials and residents concerned about the cost and protecting their connection to the river have rejected the idea of building one. The city's flood-fighting strategy plans for a maximum crest of 24 feet. But a National Weather Service forecast that indicates a 50 percent chance of a record flood has left city officials scrambling to prepare for waters of 26 feet or higher."
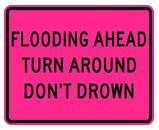
What Can I Do to Avoid Getting Caught is This Situation?
"Most flood-related deaths and injuries could be avoided if people who come upon areas covered with water followed this simple advice: Turn Around Don't Drown©.The reason that so many people drown during flooding is because few of them realize the incredible power of water. A mere six inches of fast-moving flood water can knock over an adult. It takes only two feet of rushing water to carry away most vehicles. This includes pickups and SUVs.
If you come to an area that is covered with water, you will not know the depth of the water or the condition of the ground under the water. This is especially true at night, when your vision is more limited.
Play it smart, play it safe. Whether driving or walking, any time you come to a flooded road, Turn Around Don't Drown©
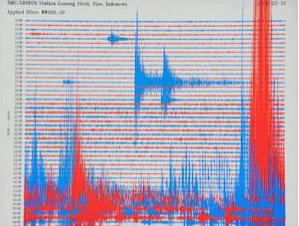
"What is clear is that for the 6.2 years since 2004, there have been more great earthquakes around the world than in any 6.2-year period throughout the 110-year history of seismic recordings," says Thorne Lay at the University of California."


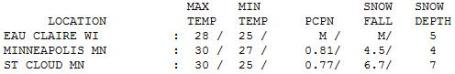
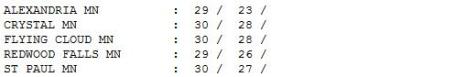
Wednesday Climate Data. It was an unusually cold, snowy day across the state, highs in the upper 20s to 30 statewide. As of late Wednesday snow on the ground ranged from 4" at MSP to 7" at St. Cloud.
Paul's SC Times Outlook for St. Cloud and all of central Minnesota:
TODAY: Sun returns, meltdown begins. Winds: E 5-10. High: 26
THURSDAY NIGHT: Partly cloudy and chilly. Low: 12
FRIDAY: Intervals of sun, still sloppy. High: 30
SATURDAY: Cloudy. Storm stays south of MN. Low: 14. High: near 30
SUNDAY: Peeks of sun, most (new) snow gone. Low: 15. High: 32
MONDAY: Plenty of sun, still chilly. Low: 14. High: 34
TUESDAY: Muffled sun, a bit milder. Low: 18. High: 39
WEDNESDAY: Clouds increase, hints of spring. Low: 25. High: 42
Counting My Blessings
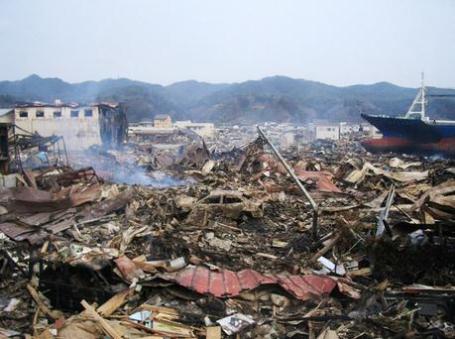
Overheard at the check-out aisle at Walgreen's: "I'm sick of snow." Long pause. "Me too. Just be glad you're not in Japan, tracking clouds of radiation." That hit me like a cold smack across the face. I will NOT whine about the slush.
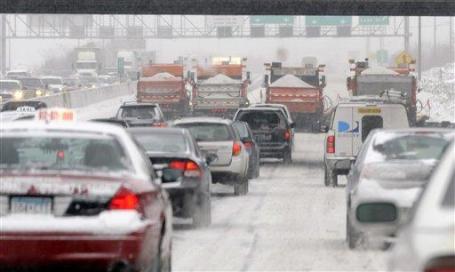
This is pretty typical fare for March. Tournaments seem to attract storms. Just 2 years ago March was still our snowiest month of the year (now it's January).
Welcome to the 5th snowiest winter season on record; 84.6" (and counting). More important for people living along streams and rivers, over 1.3" of liquid water fell from our recent storm: rain, ice and snow. Now all that (additional) water needs to be factored into flood crest predictions. Hydrology (river forecasting) is a science within a science, and I defer to the pros at NOAA in Chanhassen. Check the weather blog for the latest updates and online tools.
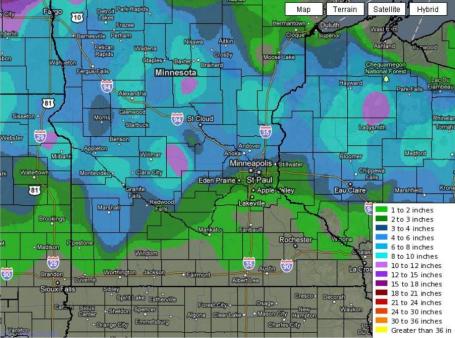
This storm was a stomach-churner: 1.4" at Farmington, over 6" downtown, but 8.5" at Andover. Most of that new snow will melt within 72 hours.
No big storms in sight; chilly 30s through the weekend slowing the rate of snow melt; a little good news there. 40s return next week - 50s, even 60 for the 1st week of April.
John Abraham: Jason Lewis Misled Readers On Global Warming. From an editorial in the Star Tribune: "Jason Lewis's recent article on global warming ("Getting warm. Or cool. Let's make policy!" March 20) contained so much misleading and inaccurate information that it requires a response. Someone reading this article might believe that Lewis knows more about climate science than the 97 percent of scientists who agree that humans are causing the Earth to warm. Rather than focusing on what solutions are best, he wrote a confusing and conflicting piece that gives the impression that the Earth is not warming, and that scientists are manipulating data.
In his article, Lewis:
•Made an unsubstantiated and untrue claim that scientists hid a "decline in temperatures." Where is the evidence of this? No scientists made any statement that they were hiding a decline in temperatures. This is a distortion of a stolen e-mail that was actually referring to increasing temperatures.
•Took aim at reputable institutions, including NASA. He claims that NASA has "erroneously reported that readings over the last decade were warmer than the 1930s, when in fact the opposite was true." This statement is inaccurate, as is his claim that NASA recanted 1998 as being the hottest year in U.S. history.
•Claimed that temperatures have been declining since 1940. They have not. No scientist would agree with that statement.
•Alleged that climate change theory is based on models and not real data. This, too, is inaccurate. The fact that increasing greenhouse gases cause the earth to warm is known from data that go back 800,000 years. Is that a long enough record?
•Suggested that since 1998, temperatures have leveled off and might be decreasing now. It turns out that the hottest three years on record, according to NASA, were 2010, 2005 and 2009. It is tough to have this trend occur in a cooling world.
I could go on, but you get the point. Lewis knows very little about climate issues, and much of what he knows is provided by think tanks, not scientists. We desperately need good information to move forward collectively on solutions to this problem. I'll bet Lewis is deeply suspicious of regulatory solutions to climate change; if so, he should come up with alternative, market-based ways to reduce global warming. Then we can select the best plans that offer the highest payback on investment. If we act wisely, our solutions to global warming will give us many benefits, including more jobs, energy diversity and improved national security. Who can be against that?"
John Abraham is an engineering professor at the University of St. Thomas.
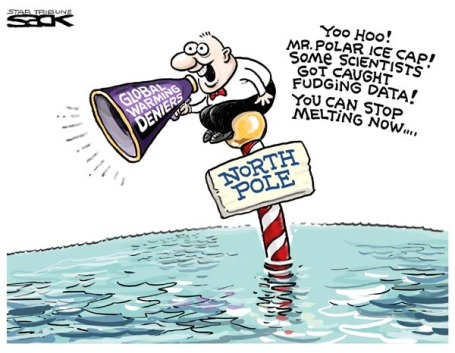
Josh Leonard: Respect Science When It Comes To Climate Change. Another rebuttal to Jason Lewis's recent editorial in the Star Tribune: "Do you ever notice how climate-change deniers don't use science? They seem to have an argument until you realize that it's not scientific. A March 20 column by Jason Lewis ("Getting warm. Or cool. Let's make policy!") was an example.
Whenever I encounter an argument denying global warming, I apply the following three-part filter:1. Does it cite scientific research?
2. Does it look at long-range data?
3. Does it explain major global trends regarding:
a. Global glacial retreat?
b. The polar sea ice cap disappearing?
c. The 10 hottest years on record occurring within the past 14 years?
Josh Leonard, of St. Paul, is a science teacher.
No comments:
Post a Comment