4F. average high for May 4.
.36" rain predicted today for St. Cloud (NAM model). Best chance of rain: morning and midday hours.
Saturday: outlook has improved - most of the day may be dry with peeks of sun, best chance of showers south/west of St. Cloud. highs in the mid/upper 60s.
Mother's Day: sun possible morning/midday with increasing PM clouds, a few showers/T-storms possible late.
Walleye Opener Extended Outlook: GFS hinting at a nice weekend, sunshine, highs in the 60s north, even some low 70s south.
Promising Opener? Will the planets align this year? Minnesota's Walleye Fishing Opener (a pretty big deal from what I hear) is still 8 days away, but the long-range "guestimate" for May 14 is promising: 60s, even some low 70s (south), plenty of sun and no rain in the outlook - yet. What can possibly go wrong? So far so good.
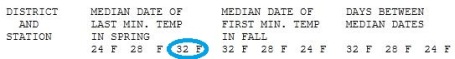
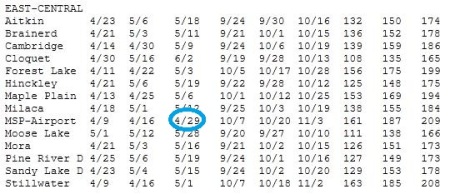
Frost-Free? According to the Minnesota State Climatology Office the average median date of the "last 32 F." temperature at MSP-International is April 29. But that factors in the "urban heat island" (concrete, asphalt, big sweaty people keeping the immediate metro 5-15 degrees warmer than the surrounding suburbs). The median date of the last freezing temperature in Stillwater is May 1, May 9 at Cambridge and May 11 up in Brainerd. It's probably OK to plant trees and perennials, but I might wait at least another week to 10 days for annuals - to be absolutely safe. It's been a chilly spring - better to err on the side of waiting a few extra days. Rough rule of thumb: wait until Mother's Day. This year I'd wait until Fishing Opener weekend.
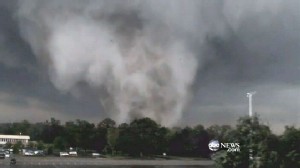
178 tornadoes reported in a 24-hour period last Wednesday-Thursday, making this the largest single-day outbreak in U.S. history. This number may still rise. More details on the historic tornado outbreak below.
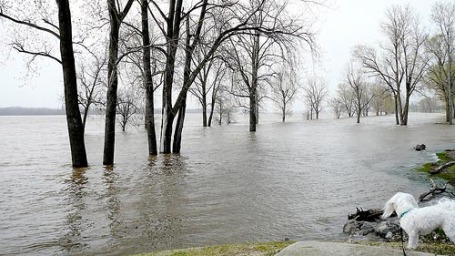
Muddy Dice. With a warmer atmosphere able to hold 4% more water vapor than 30 years ago are we "loading the dice" in favor of more flood events?
1993 Mississippi River Flood: "1 in 500 year event."
2008 Mississippi River Flood: "1 in 200 year event."
2011 Mississippi River Flood: "1 in 500 year event" (preliminary)
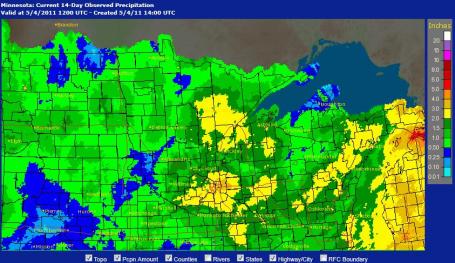
Most Minnesota Lakes: Brimming With Water. The Lake Minnetonka Conservation District issued a "High Water Alert" for Lake Minnetonka back on April 14, which was (coincidentally) the date of the ice-out on 'Tonka. LMCD Greg Nybeck explains: "The Minnehaha Creek Watershed District has been discharging a great deal of water through the Grays Bay Dam; however, lake levels have remained the same because of the precipitation we have received." As you can see on the map above, the Twin Cities metro has picked up 2-3" rain in just the last 2 weeks, according to NOAA. Many lakes are running high, and that may be an additional concern for Minnesota's Fishing Opener coming up the weekend after next.
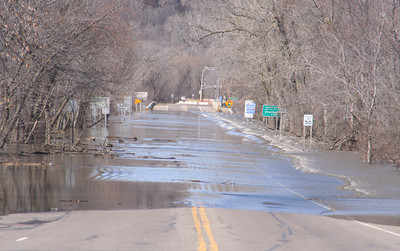
Highway 101 River Crossing To Open May 4. Whew, glad that's over. I can't remember the last time 101 was closed (for the better part of 6 weeks). Details from the Chaska Herald: "Highway 101 spanning the Minnesota River between Flying Cloud Drive in Chanhassen and downtown Shakopee will reopen to traffic at 3 p.m. Wednesday, May 4, according to a MnDOT press release. Highway 101 has been closed since March 23. Crews were able complete repairs two days earlier than originally estimated. For real-time information on road and lane closures, visit www.511mn.org. As of 2:15 p.m., the river was 24.85 feet in Jordan."
Minnesota Climate Summary. Minnesota climatologist Greg Spoden has a good summary of where we stand in terms of rainfall, statewide. Click here to read the full report. Here's an excerpt:
- Significant flooding was reported across Minnesota during much of the month of April. River levels reached major flood stage along the Mississippi River, the Minnesota River, the St. Croix River, and the Red River, along with their tributaries. Advanced warning, effective flood fighting measures, and somewhat favorable March and April weather helped to minimize damage.
- April precipitation totals were near, to well above, average in all Minnesota locations other than west central counties. Monthly precipitation totals exceeded average by an inch or more in southeastern Minnesota as well as many counties in the northern one third of the state.
- Monthly mean temperatures for April 2011 were somewhat below average across Minnesota. It was the fifth consecutive month of below-average temperatures. It was a month with a dual personality, with mild temperatures early in the month being offset by very cold temperatures at month's end. The cold late-April temperatures and wet weather slowed the onset of spring and hindered agricultural field work.
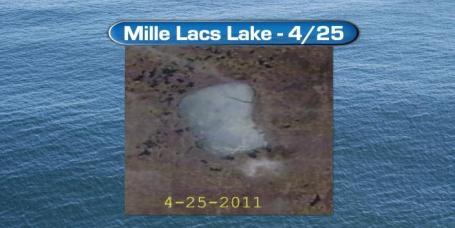

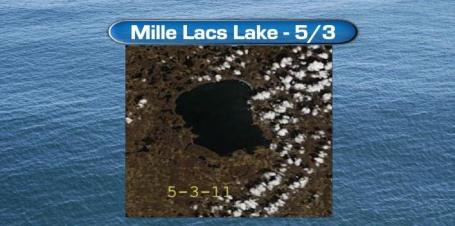
Chronology Of An Ice-Out. High-resolution satellite imagery shows the ice coming off Lake Mille Lacs. Here are more details (and resources for Minnesota fishing enthusiasts), courtesy of meteorologist Todd Nelson at WeatherNation.
Ice Out 2011: May 1 (6 days away from a record!)
Average Ice Out: April 24.
Latest Ice Out Ever: May 7, 1965
Earliest Ice Out Ever: April 2, 2000
Years of Data: 54
BTW - The 2011 Walleye Opener is on May 14 this year.
The Governor's Opener will be held in Grand Rapids this year: Opener will be based at Ruttger's Sugar Lake Lodge, with fishing on Pokegama and other area lakes. Grand Rapids last hosted the Governor's Fishing Opener in 1999...the community's slogan, "It's in Minnesota Nature."
Here's a link: http://www.mngovernorsopener.com/
Ice Jam Caught On Tape. Check out this remarkable YouTube clip, courtesy of www.moonshineshowcase.com. This shows the power of water (and moving ice), captured on April 2 near Wabasha.
Looking Better For Saturday. Previous models pushed a band of showers (even a few T-showers) across the metro area on Saturday, implying at least a few hours of rain. But last night's 00z NAM run pulled back, in fact it currently prints out NO rain for Saturday in the Twin Cities, although showers may linger over southern and western Minnesota. We still can't rule out a shower or two, but much of the day should be dry, with more clouds than sun, highs in the mid to upper 60s. Could be worse.
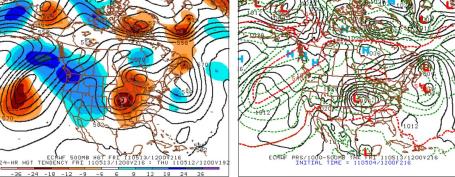
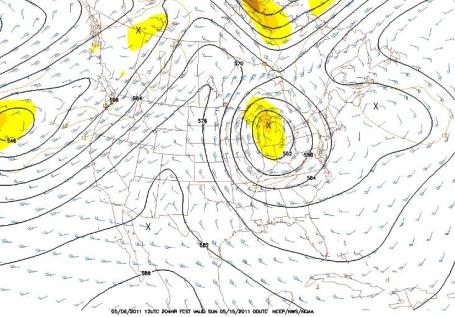
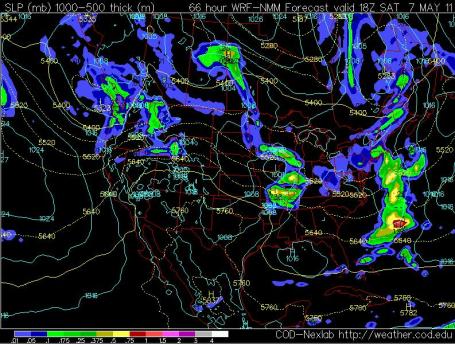
Major Storm Next Week? The European ECMWF model prints out a "closed low" just to our south, over Iowa, a week from today. The best chance of severe weather will probably stay south of Minnesota, but a surge of warmth and moisture approaching from the Gulf of Mexico could spark an outbreak of strong/severe storms late Wednesday into Thursday of next week - with a potential for heavy rain (and high winds) by Friday as the storm tracks (slowly) to our south. Too early to get more specific than that - it's still roughly a week out.

Faith And Hope Amidst The Ruins. Getreligion.org has a story about the power of faith, and how a strong belief in God is helping tornado survivors get through a very tough time down south: "First, there was that one big story. Then, there was that EVEN BIGGER STORY. Down South, though, about 350 people are dead and thousands more hurt and homeless after a swath of tornadoes cut a deadly path across seven Southern states — hitting Alabama hardest — last Wednesday night. It’s the nation’s deadliest twister outbreak since the Great Depression and America’s worst natural disaster since Hurricane Katrina, according to the news reports I’ve read. We exist here at this friendly little weblog because the mainstream media often do not GetReligion. It does not take an editor with a seminary degree, however, to know that on the Sunday after a big disaster in the Bible Belt, reporters better crawl out of bed long before noon and go to church. In my Associated Press days, I always loved these assignments because the guild contract required paying reporters a full day’s salary even if they only worked a few hours of overtime on an off day. So you’d go to a morning service — or maybe two or three — feed your quotes to the person writing the day’s big roundup and be home by noon with a nice little bit of extra pay."

Is It Possible To Build A Tornado-Proof Home? The answer seems to be a (qualified) yes. CNN highlights a company, Kodiak Steel Homes, that uses reinforced steel in the construction. This adds about 5% to the overall cost of building a home, but the company claims its homes can withstand winds up to 140 mph for at least 4 hours. Nothing will withstand an EF-4 or EF-5 tornado, but for smaller tornadoes this seems to be a viable option. And from the outside you can't even tell that there is reinforced steel holding up that house. Not a bad option, especially for residents of Tornado Alley and "Dixie Alley".
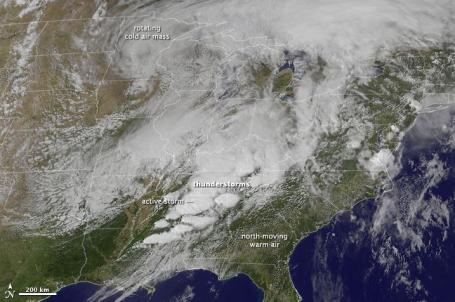
Severe Tornado Outbreak In The Southern United States. NASA's Earth Observatory has a write-up explaining the atmospheric dynamics behind last week's record-breaking outbreak of tornadoes: "April 27 and April 28, 2011, brought the deadliest tornado outbreak in the United States since 1974. By dawn on April 28, at least 250 people had been killed in 6 states. Alabama was the hardest hit, with 162 confirmed dead as of Thursday morning. This image shows the storms at 1:45 p.m. U.S. Central Daylight Time on April 27, and the animation shows the development of the weather system that spurred the widespread tornadoes. The images are from the GOES satellite. The animation starts on April 26 and runs through the morning of April 28. The ingredients for severe weather are evident in the cloud patterns. A relatively stable mass of cold air—visible as a swirl of more-or-less continuous clouds—rotates in the north along the top of the image. Meanwhile, moist air pushes north and west from the Atlantic Ocean and Gulf of Mexico. The warm air contains small low clouds. The collision between two such air masses is enough to generate severe weather, but the weather also was amplified by the jet stream on April 27. Though not directly visible in the image, the narrow band of fast-moving wind blew north and east between the two air masses. With surface winds blowing from the south and east, and the jet stream blowing from the west, powerful smaller-scale circulation patterns generated lines of intense thunderstorms. The thunderstorms shown in this image began to rise over Louisiana midway through the day on April 27—around 16:00 UTC or 11:00 a.m. local time—and moved across Mississippi and Alabama through the afternoon."
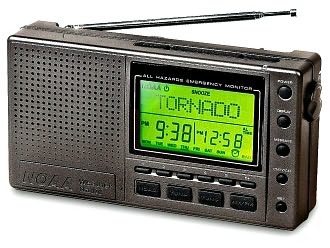
Stations Go Multi-Platform To Cover Storms. I thought this was an interesting article (at tvnewscheck.com), focusing on how TV stations in the south covered last week's killer tornadoes. One big problem: a wave of storms earlier in the day knocked out power to hundreds of thousands of homes. Many people were unable to watch TV to receive potentially life-saving alerts later in the afternoon, when the most damaging tornadoes spun up. So it's becoming increasingly critical to make sure information is available on cell phones (which would not be impacted by power outages, unless the cell towers were taken out as well). It also points out the glaring need for every household to invest in a NOAA Weather Radio. They're battery-operated, so even if power goes out you can still get the county-specific information you need to protect your family: "Still, a TV station can have the best technology, staff and backup power in the world but it all comes to naught if viewers are on the move or the power goes out. “There were 100,000 homes without power in our market,” said Bill Payer, news director at WIAT, New Vision’s CBS affiliate in Birmingham. “Sometimes we say we’re doing great stuff here … but you wonder if anyone can see it. It’s not as simple or simplistic anymore as someone at home sitting in front of the TV.” That was a common theme among broadcasters throughout the hard-hit South — the information delivery model is changing and in emergency situations particularly, you need to use all conduits available. “There are three questions I task everybody in newsroom with asking of viewers: What do you want, when do you want it, how do you want it?” said Richard Russell, director of digital journalism at WJTV, Media General’s CBS affiliate in Jackson, Miss. (DMA 90). “It’s not about us dictating to viewers anymore that you’ve got to watch our newscast at whatever time. They want the information they want when they want, how they want it. That can change moment to moment. When it’s severe weather, they want it on their cell phones.”
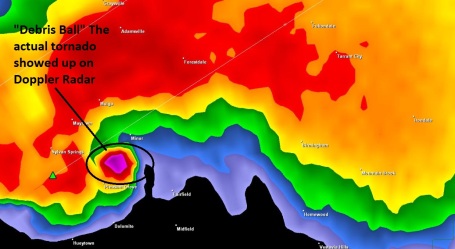
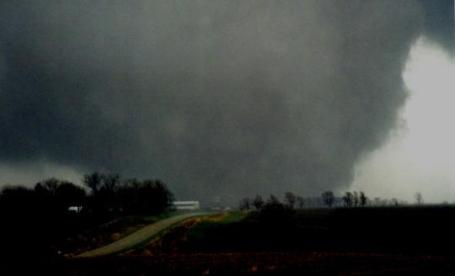
Stark Evidence Of A Tornado. I wanted to take one last opportunity to show you this Doppler radar image taken from last week's tornado outbreak, courtesy of "omahatornadochaser." It shows the "debris ball", the actual tornado itself, showing up vividly on the reflectivity display. Normally, tornadoes are too small to actually show up on Doppler - we normally see evidence of rotation, sometimes a vivid "couplet" is evident on the velocity display, hinting at powerful rotation capable of spinning up a tornado. But last weeks' tornadoes were so large (over 1 mile wide at times) that the actual DEBRIS from the tornado itself was clearly visible on reflectivity displays. TV meteorologists were able to pinpoint the actual tornado itself, not the rotating parent "supercell". I can't remember the last time I saw so many examples of actual tornadoes showing up on Doppler radar. Simply incredible.
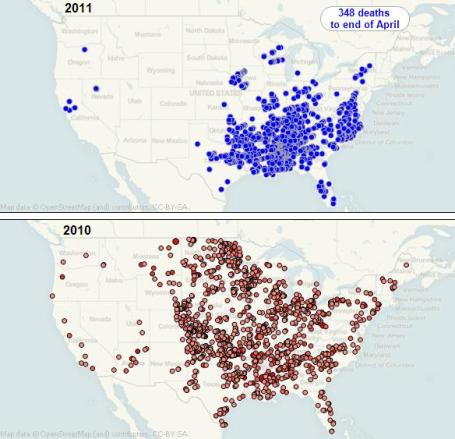
Tornadoes: Comparing Six Decades Of Devastation. Newscientist.com has an interactive map and the story: "2011 is only four months old, yet this is already one of the deadliest years for US tornadoes on record. As Alabama and other states count the human cost of the twisters that ravaged the South last week, you can use the graphic below to compare preliminary tornado reports from 2011 with historical patterns. In 2011, there may be multiple reports for some tornadoes spotted at different points along their tracks. For previous years, the points in the graphic plot the start of confirmed tornado tracks, and are sized according to the number of deaths caused. Roll over the points to see more information about each tornado, use the slider to scroll through the years, and the tab to view death tolls since 1950."
NOAA continues post-tornado investigations; latest stats, photos available online. NOAA remains actively involved with meteorological forensic investigations following last week’s outbreak of killer tornadoes. A wide variety of information is available below and online at http://www.noaanews.noaa.gov/april_2011_tornado_information.html.
- National Weather Service field teams from 21 forecast offices spanning 14 states continue to survey tornado damage and assess EF (Enhanced Fujita Scale) ratings for the massive tornado outbreak that occurred April 25-28, 2011. The situation and resulting information is rapidly evolving, with forty-five new surveys completed in the last 24 hours alone.
- National Weather Service forecast offices issued life-saving tornado warnings with an average lead-time of 24 minutes. Warnings were in effect for more than 90 percent of the tornadoes.
- To date, NOAA estimates the outbreak spawned 305 tornadoes, making this the largest tornado outbreak in history – surpassing the April 3-4, 1974 outbreak with 148 tornadoes. So far, the National Weather Service has surveyed damage from 178 tornadoes and determined that two topped the scale at EF-5, four were EF-4, and 21 were EF-3. Dozens more have been categorized as EF-2 or lower.
- NOAA estimates there were more than 600 tornadoes during the month of April 2011, shattering previous records. The previous April tornado record was 267, set in 1974. The previous record number of tornadoes during any month was 542, set in May 2003. So far there have been an estimated 881 tornadoes in 2011. The annual tornado record is 1,817, set in 2004. May is historically the most active month for tornadoes.
- With an estimated 327 deaths, this is the 3rd deadliest tornado outbreak on record, behind 1925 with 747 and 1932 with 332. So far, 2011 is the 13th deadliest year for tornadoes on record with 369. The deadliest year on record is 1925 with 794.
- Emergency responders and members of the public can now get a birds-eye view of the tornado damage. NOAA aviators and technicians continue to conduct aerial imaging flights over some of the hardest-hit areas as requested by federal, state and local disaster response agencies.
Images are being collected at 5,000 feet from a NOAA aircraft equipped with specialized remote sensing equipment. After images undergo quality-checking and processing, they appear on a public website to assist responders with search and rescue operations, routing personnel and machinery, planning recovery efforts, and better understanding damage caused to the environment.
- NOAA Aerial Image Database: http://ngs.woc.noaa.gov/storms/apr11_tornado
- NOAA Photo Gallery: http://oceanservice.noaa.gov/al_tornado/images.html
Levee Detonation Lowers River, Triggers New Lawsuit. What a mess. To protect a city (Cairo, Illinois) the Army Corp of Engineers had to blow up a levee, swamping thousands of square miles of fertile farmland under a torrent of muddy water, ruining the growing season for hundreds of farmers downstream. Here's the latest from Reuters: "The effort to protect river towns in Illinois and Kentucky from rising floodwaters by blowing open a levee and inundating more than 100,000 acres of Missouri farmland appeared to be slowly working on Tuesday. The controversy surrounding the extraordinary demolition continued, with farmers affected by it filing suit. Dick Durbin, a Democratic Senator from Illinois, also cautioned that the endangered river towns, including Cairo at the southern-most tip of Illinois, were "not out of the woods yet." The National Weather Service said the river gauge at Cairo, Illinois, where the Mississippi and Ohio rivers meet, showed water levels had dropped more than a foot-and-a-half since 10 p.m. last night, when the U.S. Army Corp of Engineers blasted a hole in a protective embankment downriver from the historic town. "The plan performed as expected," Jim Pogue, a U.S. Army Corps of Engineers spokesman, said in a telephone interview. By 4 p.m. local time on Tuesday, the gauge at Cairo had dropped to 60.08 feet and was expected to continue dropping through the weekend. The Cairo gauge topped out at 61.72 feet, its highest level since 1937, on Monday night before the Corps detonated the levee to allow the Mississippi River to cope with the rising waters of the Ohio River."
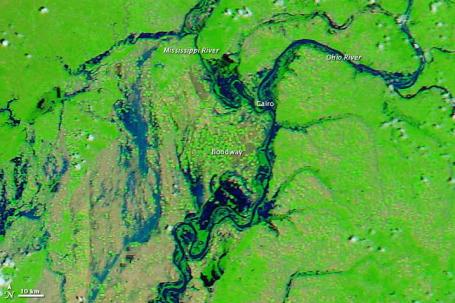
Cairo, Illinois - April 29, 2011. Before the levee breach by the U.S. Army Corp of Engineers.
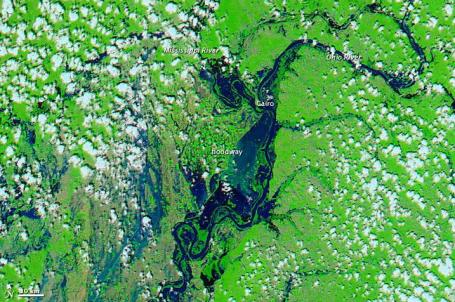
Cairo, Illinois - May 3, 2011. After the levee breach. NASA's Earth Observatory has the details: "Late on May 2, 2011, in an effort to spare Cairo, Illinois, the U.S. Army Corps of Engineers used explosives to breach a protective levee near the confluence of the Ohio and Mississippi Rivers. As predicted, the two-mile hole in the levee flooded 130,000 acres of nearby farmland in what is known as the Birds Point-New Madrid Floodway. The Moderate Resolution Imaging Spectroradiometer (MODIS) on NASA’s Aqua satellite captured these images of the area on May 3, 2011 (top), and April 29, 2011 (bottom). Both images use a combination of visible and infrared light to increase constrast between water and land. Water ranges in color from electric blue to navy. Vegetation is green. Clouds are pale blue-green and cast shadows onto the land surface below. Tiny squares of green in the April 29 image show that the floodway consists of farmland. The image from April 29 also shows flooded conditions along the Ohio and Mississippi Rivers. (See an image from 2010 for a comparison.) In the image acquired on May 3, the floodway downstream of Cairo is submerged. The same day that MODIS acquired the image, the Advanced Hydrological Prediction Service of the U.S. National Weather Service reported that the water level for the Ohio River at Cairo had dropped, although it still remained at major flood stage."
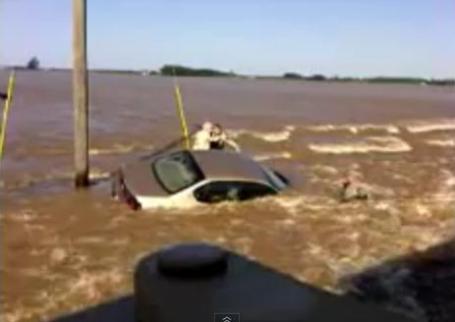
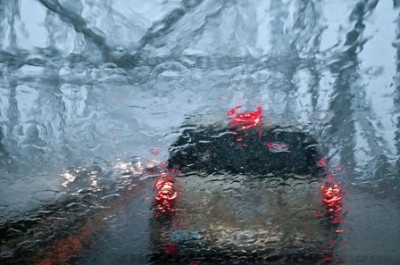
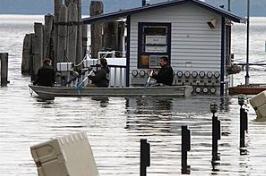
Daring Rescue Caught On Tape. A 93 year old woman was rescued from her car in Missouri by the National Guard - all of it caught on tape in this YouTube video. This is why you need to "turn around - don't drown" (quoting the National Weather Service). All it takes is 2 feet of rapidly moving water to turn your vehicle into a boat, with potentially tragic results.
Record-Shattering Flooding On Lake Champlain. Accu Weather has the story: "Record-shattering flooding is occurring along Lake Champlain in Vermont, New York and Quebec. The flooding may continue for weeks and will continue to impact far more than recreational activities and ferry crossings through the spring. The combination of runoff from melting snow early this spring and, more recently, heavy rain has Lake Champlain at record levels. The effects of heavy snow over the winter and a "slow" spring are hitting home. Burlington, Vt., has received over 9 inches of rain since April 1, which is three times their normal rainfall for the period. Many places in the region are in the same boat; no pun intended."
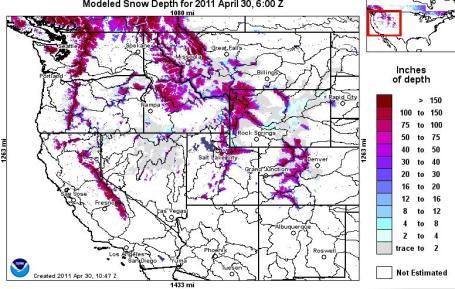
A Little May Skiing? According to the State of California, snow cover is still running 144% of normal throughout much of the west - plenty of water for irrigation, hydroelectric power and drinking in the months to come. NOAA has the latest here. PDF Press release from California here.
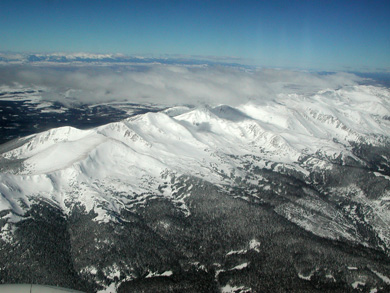
Snowpack Breaking Records Set 30 Years Ago. At this rate they'll be skiing at Breckenridge into the first week of June. Here's the story from KUSA-TV: "The snowpack in the mountains has reached an all-time high, breaking records set in the 1970s. The Natural Resources Conservation Service says when the last record was set in 1978 at the Tower measuring site northeast of Steamboat Springs, there was 71.1 inches of water content. This year it's reached 73 inches of water content. So much snow has fallen this year that in the month of April the 16 foot tall gage used to measure water content was covered by snow. They had to add an extension to continue measuring for the rest of the season. "April was a pretty remarkable month. We saw continued snowfall throughout the entire month when normally we would see a peak at mid-month and then the snowpack starts to melt. But, this year during April we just continued to see snowpack percentages climb and water content climb throughout the whole month," Mike Gillespie, snow survey supervisor, said."
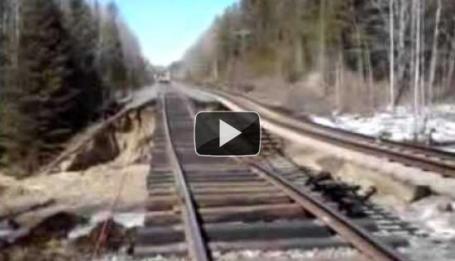
New Landslide Video: Railway Washout In Canada. Here's the remarkable clip from the "Landslide Blog" (who knew there was such a thing?) This is courtesy of the American Geophysical Union: "Thanks to several people who sent me a link to this Youtube video of a railway washout occurring at Stackpool in Ontario, Canada in the middle of last month."
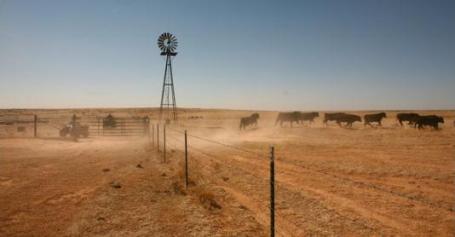
Survivor Of Dust Bowl Now Faces A Fiercer Drought. Parts of Texas and Oklahoma are experiencing the driest conditions in over a century. The New York Times has the story: "BOISE CITY, Okla. — While tornadoes and floods have ravaged the South and the Midwest, the remote western edge of the Oklahoma Panhandle is quietly enduring a weather calamity of its own: its longest drought on record, even worse than the Dust Bowl, when incessant winds scooped up the soil into billowing black clouds and rolled it through this town like bowling balls. With a drought continuing to punish much of the Great Plains, this one stands out. Boise (rhymes with voice) City has gone 222 consecutive days through Tuesday with less than a quarter-inch of rainfall in any single day, said Gary McManus, a state climatologist. That is the longest such dry spell here since note-keeping began in 1908. The Dust Bowl of the 1930s, caused in part by the careless gouging of the earth in an effort to farm it, created an epic environmental disaster. Experts say it is unlikely to be repeated because farming has changed so much. Boise City recovered from the Dust Bowl and has periodically enjoyed bountiful years since. But this drought is a reminder of just how parched and unyielding life can be along this wind-raked frontier, fittingly called No Man’s Land, and it is not clear how many more ups and downs Boise City can take."
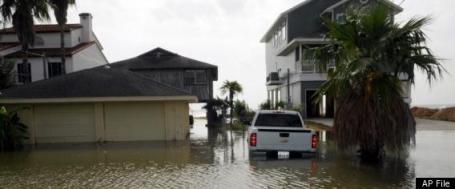
Hurricanes Pose Risk To 1.8 Million Coastal Homes In U.S.: Report. Huffington Post has the details: "WASHINGTON -- More than 1.8 million homes along the Gulf and Atlantic coasts are at great risk of being damaged by a hurricane, three times the number located in federally defined flood zones, according to a report released Tuesday. The report by CoreLogic, a private real estate data firm, focused on the potential impact of storm surge, which is the indirect damage from water and flying debris triggered by strong winds. Roughly two-thirds of the homes cited in the report are located outside Federal Emergency Management Agency flood zones. Storm surge can cause extensive damage when seawater breaks through structures and carries debris with it. That's what happened in New Orleans in 2005, when storm surge from Hurricane Katrina broke the levee system and flooded most of the city and surrounding parishes. The homes most at risk are concentrated in Virginia Beach, Va., New Orleans, Tampa, Long Island, N.Y., and Miami. The report examined the exposure of a single home to storm surge in 10 U.S. metro areas. It used computerized models, which generated the probability of a hurricane hitting a particular area, residential density rates, elevation, levees and barriers and water depths along those coastal areas. The report also looked at the damage caused by a storm's direct impact. Florida and Texas are the states most vulnerable to a direct hit. Corpus Christi, Galveston and Houston and Jacksonville, Miami, Palm Beach and Tampa were cited as facing the greatest risk in those states. The areas potentially most affected by a Category 5 hurricane, the highest category storm with wind gusts of at least 156 mph, include the waterside resort city of League City, Texas, near Houston; the Palmetto and Perrine sections of south Miami, near Biscayne Bay; and the Tampa suburb of Port Richey."

Did Sunday's Bin Laden Raid Use New, Retrofitted (Stealth) Helicopters? Once again ABC News seems to be out in front with new details on what really went down a few days ago: "Before an elite team of U.S. Navy SEALs executed a daring raid that took down Osama bin Laden, the commandos were able to silently sneak up on their elusive target thanks to what aviation analysts said were top secret, never-before-seen stealth-modified helicopters. In the course of the operation that cost the al Qaeda leader his life, one of the two Blackhawk helicopters that carried the SEALs into bin Laden's Pakistani compound grazed one of the compound's wall and was forced to make a hard landing. With the chopper inoperable, at the end of the mission the SEALs destroyed it with explosives. But photos of what survived the explosion -- the tail section of the craft with curious modifications -- has sent military analysts buzzing about a stealth helicopter program that was only rumored to exist. From a modified tail boom to a noise reducing covering on the rear rotors and a special high-tech material similar to that used in stealth fighters, former Department of Defense official and vice president of the Lexington Institute Dan Goure said the bird is like nothing he's ever seen before."

Behind The Hunt For Bin Laden. In case you missed this, the New York Times ran a fascinating article on the events leading up to the raid on Bin Laden's compound. It's a must-read: "WASHINGTON — For years, the agonizing search for Osama bin Laden kept coming up empty. Then last July, Pakistanis working for the Central Intelligence Agency drove up behind a white Suzuki navigating the bustling streets near Peshawar, Pakistan, and wrote down the car’s license plate. The man in the car was Bin Laden’s most trusted courier, and over the next month C.I.A. operatives would track him throughout central Pakistan. Ultimately, administration officials said, he led them to a sprawling compound at the end of a long dirt road and surrounded by tall security fences in a wealthy hamlet 35 miles from the Pakistani capital. On a moonless night eight months later, 79 American commandos in four helicopters descended on the compound, the officials said. Shots rang out. A helicopter stalled and would not take off. Pakistani authorities, kept in the dark by their allies in Washington, scrambled forces as the American commandos rushed to finish their mission and leave before a confrontation. Of the five dead, one was a tall, bearded man with a bloodied face and a bullet in his head. A member of the Navy Seals snapped his picture with a camera and uploaded it to analysts who fed it into a facial recognition program."

Looking For A Gently-Used Tornado Intercept Vehicle? How good is your life insurance policy? If you have an extra 75k in your pocket (and you want to get VERY close to the next tornado) consider this "reinforced" vehicle, highlighted in gizmag.com: "Hey, you wanna drive into a tornado? You could, if you've got somewhere over US$75,000 to spend on the right vehicle. That's the reserve price on the Tornado Attack Vehicle, which has just been put up for auction on eBay. The armored vehicle was made famous by storm chaser Steve Green, who used it in 2004 to become the first person to intentionally drive into – and survive – a tornado. If you're not the competitive type, you could even just "Buy it Now" for a cool $100,000. The Tornado Attack Vehicle, or TA-1, was originally built by Jeep to race at Baja California. After five years and over half a million dollars-worth of work, it now sports a 700-horsepower V-8 engine, 16-gauge steel panels coated with impact-resistant polyurethane, and a hydraulic system that allows it to drop its belly to the road in order not to be blown over when parked in high winds. Its windows and wheel wells are protected with bulletproof M10 Lexan, while its windshield incorporates three coats of DuPont Mylar film – just a single sheet is said to be able to stop a .38 caliber bullet. Although it's no doubt a thrill-seeking machine, the TA-1 was designed primarily to gather data on tornadoes, and therefore also includes two data loggers and various scientific weather instruments."

Apple Patent Application Indicates That "Jobs May Have Lied". Hey, I'm still a big fan of Apple, even though they may be tracking my (boring) existance via my trust iPhone 4. Here's the story from gizmag.com: "The ongoing kerfuffle over Apple devices allegedly tracking their users' locations has taken yet another turn. It all started on April 20th, when tech bloggers Alasdair Allan and Pete Warden reported their discovery that iPhones and 3G iPads running iOS4 were supposedly maintaining a stealth file of locations that the devices had traveled to – with their users. Apple responded on April 27th, stating that the devices were simply anonymously contributing to a database of local Wi-Fi hotspots and cell towers, that helped to triangulate the phones' location faster than GPS alone. Now, however, a just-discovered patent application filed by Apple in 2009 has some people doubting that claim. The application, entitled Location Histories for Location Aware Devices, begins with an abstract that states: A location aware mobile device can include a baseband processor for communicating with one or more communication networks, such as a cellular network or WiFi network. In some implementations, the baseband processor can collect network information (e.g., transmitter IDs) over time. Upon request by a user or application, the network information can be translated to estimated position coordinates (e.g., latitude, longitude, altitude) of the location aware device for display on a map view or for other purposes. A user or application can query the location history database with a timestamp or other query to retrieve all or part of the location history for display in a map view. While not necessarily all that sinister, the description does seem to be at odds with Apple's recent statement that "The iPhone is not logging your location."

TV Ownership Declines In The U.S. Here's a new development - some people are (apparently) unplugging their TV's. I can't remember the last time I saw TV viewership levels actually coming down. MediaBistro.com has the story: "In what experts are attributing to both the current economic slide and the rise of alternative digital devices, ownership of television sets in the U.S. has dropped for the first time in 20 years. According to Nielsen, 96.7 percent of American households currently own TVs, down from 98.9 percent. Here’s The New York Times: There are two reasons for the decline, according to Nielsen. One is poverty: some low-income households no longer own TV sets, most likely because they cannot afford new digital sets and antennas. The other is technological wizardry: young people who have grown up with laptops in their hands instead of remote controls are opting not to buy TV sets when they graduate from college or enter the work force, at least not at first. Instead, they are subsisting on a diet of television shows and movies from the Internet."
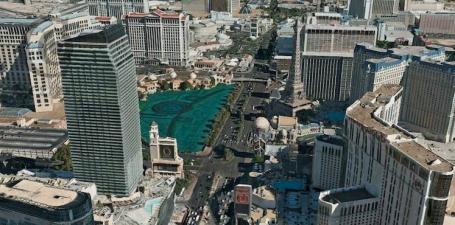
Insanely Detailed 3-D City Images Are Accurate To Within 6 Inches. It would appear that Google Earth's 3-D models are no longer the gold standard, when it comes to 3-D visualization of metropolitan areas. Fastcodesign.com has the story: "As Technology Review explains, most photo-realistic 3-D maps are generated using expensive LIDAR scanning, or -- in Google's case -- a wiki-esque approach where volunteers build and "skin" the models by hand using SketchUp. C3's method is less pricey and 98% automated. First, their DSLR-equipped planes fly over cities in multiple passes, capturing an overlapping set of images; then C3's computer-vision algorithms take over, using the differences in perspective between the images to build in stereoscopic depth (just like our brains do from the slightly different images it receives from each eye). "The image processing software generates polygon structures and then the photos are draped over them to create the realistic look," C3 spokesman Greg Spector told Co.Design. "This process is almost totally automated, so we can generate these maps quickly and cost efficiently." And how: Nokia just went public with a C3-powered mapping app."

Virtual Kiss Via USB? Just when you thought you've seen it all, along comes a story from producermatthew.com and KGO-TV: "Scientists in Japan have developed a USB device that replicates a kiss over the Internet. From KGO San Francisco: Each person has a little gadget with a straw attached. You move the straw with your tongue and your partner gets the straw moving around the same way in their mouth. Scientists say it replicates the motion of a kiss, but still lacks other properties of a smooch like breathing a moistness (but don’t worry — KGO reports those breakthroughs may come in version two"). [KGO-TV]
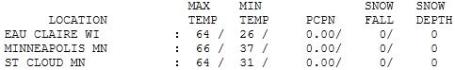

Spring Fling. What a relief, enough sun for an "average" day in early May. Yes, the winds were kicking up and clouds snuffed out a setting sun, but I didn't hear too many complaints yesterday. Highs ranged from 63 at Alexandria to 64 at St. Cloud and 66 in the Twin Cities, average for May 4. What a concept. Last year on this date the high was 79 at MSP.

Paul's SC Times Outlook for St. Cloud and all of central Minnesota:
TODAY: Rain in the morning slowly tapers, slow AM commute. Skies brighten by late afternoon/evening. Winds: NW 10-15. High: 58
THURSDAY NIGHT: Mostly cloudy and damp. Low: 45
FRIDAY: Skies brighten. Dry and mild with a mix of clouds and sun. High: 65
FRIDAY NIGHT: Mostly cloudy with a chance of showers, especially south of the MSP metro. Low: 50
SATURDAY: Gray, damp start gives way to intervals of sun. A passing shower (best chance southern/western MN). High: 66
SUNDAY: Partly sunny, chance of a few pop-up showers & T-storms late. Much of the day should be dry. Low: 51. High: near 70
MONDAY: Showers, possible thunder Low: 57. High: 68
TUESDAY: Showers taper off, slightly cooler Low: 57. High: 64
WEDNESDAY: Unsettled, showers and T-storms develop. Low: 54. High: 65
* Potential for severe storms nearby by next Wednesday night/Thursday, possibility of a significant rain storm Thursday/Friday of next week as an intense area of low pressure tracks south of Minnesota.
Tornado Nation
SPC now reports 178 (confirmed) tornadoes April 27-28, making it the largest 24-hour outbreak in U.S. history. The previous record: 148 on April 3-4, 1974. It's simply unprecedented. Will this wave of severe weather reach Minnesota? Good question. Something has energized & strengthened jet stream winds. Large north-south temperature contrasts are breeding ripe conditions for "wind shear", winds changing speed and direction with altitude - allowing thunderstorms to rotate, "protecting" warm updrafts, ultimately translating horizontal spin into a vertical vortex. We have a better understanding of how and when tornadoes form; we can track them once they form, but there's no way to predict which towns will be hit hours in advance.We may experience our first severe storm outbreak by the end of next week: the timing is tricky, but a major storm may spin up just to our south a week from today.
A few suggestions: Consider buying a NOAA Weather Radio (which works even if the power goes out), and alerts on your cell phone.
About .2 to .3" rain falls today, skies brighten Friday before another batch of showers brushes far southern Minnesota Friday night and early Saturday. Much of Saturday and Sunday may wind up dry (amazingly) with highs in the upper 60s, even some low 70s possible Sunday with just a few pop-up showers. Thundery weather arrives late Sunday; next week looks damp and stormy. Ugh.
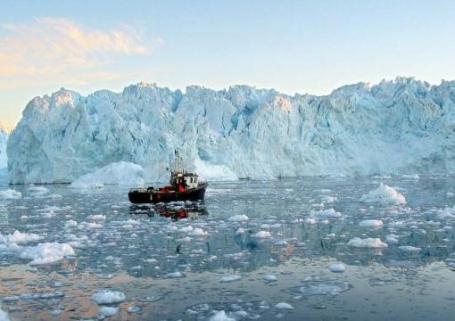
Record Arctic Warming To Boost Sea Level Rise. AFP has the story about what's happening at far northern latitudes: "OSLO — Record warming in the Arctic over the past six years will substantially contribute to a global sea level rise of up to 1.6 meters by 2100, according to a study published in Oslo Tuesday. "Surface air temperatures in the Arctic since 2005 have been higher than for any five-year period since measurements began around 1880," the Arctic Monitoring and Assessment Programme (AMAP) said. "In the future, global sea level is projected to rise by 0.9 to 1.6 meters (2.95 to 5.25 feet) by 2100 and the loss of ice from Arctic glaciers, ice caps, and the Greenland Ice Sheet will make a substantial contribution to this," the authors of the study said, stressing, however "that high uncertainty surrounds estimates of future global sea level." The melting of polar region ice could have disastrous effects on low altitude coastal regions, including in faraway regions. Temperatures are rising twice as quickly in the Arctic as on the rest of the planet, and "in the future, average autumn-winter temperatures in the Arctic are projected to increase even more," the authors said. The hike would amount to 3.0 to 7.0 degrees Celsius (5.4 to 12.6 degrees Fahrenheit) by 2080, they said. "And the Arctic Ocean is predicted to be nearly ice free in summer during this century. Likely within the next 30 to 40 years," they added."

Arctic Ice Melting Faster Than Previously Thought: Report. Another perspective on what's happening in the Arctic region from the Huffington Post: "STOCKHOLM -- A new assessment of climate change in the Arctic shows the region's ice and snow are melting faster than previously thought and sharply raises projections of global sea level rise this century. The report by the international Arctic Monitoring and Assessment Program, or AMAP, is one of the most comprehensive updates on climate change in the Arctic, and builds on a similar assessment in 2005. The full report will be delivered to foreign ministers of the eight Arctic nations next week, but an executive summary including the key findings was obtained by The Associated Press on Tuesday. It says that Arctic temperatures in the past six years were the highest since measurements began in 1880, and that feedback mechanisms believed to accelerate warming in the climate system have now started kicking in. It also shatters some of the forecasts made in 2007 by the U.N.'s expert panel on climate change. The cover of sea ice on the Arctic Ocean, for example, is shrinking faster than projected by the U.N. panel. The level of summer ice coverage has been at or near record lows every year since 2001, AMAP said, predicting that the Arctic Ocean will be nearly ice free in summer within 30-40 years. AMAP also said the U.N. panel was too conservative in estimating how much sea levels will rise – one of the most closely watched aspects of global warming because of the potentially catastrophic impact on coastal cities and island nations. The melting of Arctic glaciers and ice caps, including Greenland's massive ice sheet, are projected to help raise global sea levels by 35 to 63 inches (90-160 centimeters) by 2100, AMAP said, though it noted that the estimate was highly uncertain."
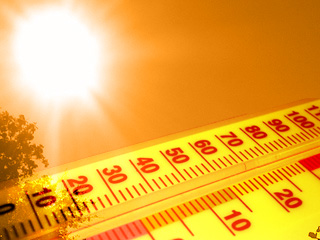
More Fatalities Predicted From Heat Waves Caused By Climate Change: Study. The Chinese site, xinhaunet.com, has the story: "LOS ANGELES, May 3 (Xinhua) -- Climate change might cause more heat waves which may in turn lead to more fatalities in U.S. cities in the coming decades, a new study has found. For the study, researchers at the Johns Hopkins Bloomberg School of Public Health developed three climate change scenarios for 2081 to 2100, which were based on estimates from seven global climate change models and from mortality and air pollution data for the city of Chicago from 1987 to 2005. The data were limited to the warm season from May to October of each year. The researchers calculated that the city of Chicago could experience between 166 and 2,217 excess deaths per year attributable to heat waves using three different climate change scenarios for the final decades of the 21st century. Global climate change is anticipated to bring more extreme weather phenomena such as heat waves that could impact human health in the coming decades, the researchers concluded in the study published in the May edition of the journal Environmental Health Perspectives. "Our study looks to quantify the impact of increased heat waves on human mortality. For a major U.S. city like Chicago, the impact will likely be profound and potentially devastating," said Roger Peng, PhD, lead author of the study and associate professor in the Department of Biostatistics at the Bloomberg School of Public Health. "We would expect the impact to be less severe with mitigation efforts including lowering CO2 emissions."
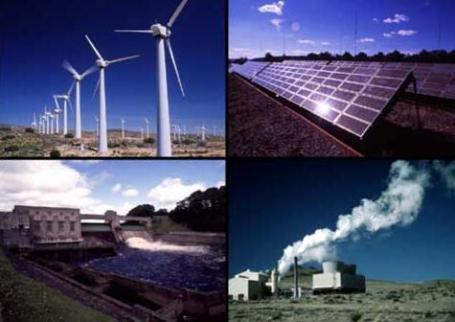
US Renewables "Bible" Says In Report That Clean Energy Can Outstrip Demand. Bloomberg News has an update. What's it going to take for us to get even more serious about renewables like solar, wind and geothermal? $6/gallon gasoline? "Wind and solar power are among six renewable energy options that have the potential to outstrip total world energy needs and may grow as much as 20-fold over the next four decades, a draft United Nations report said. Geothermal, biomass, solar, wind, hydropower and electricity from the ocean’s waves and tides could more than meet the global energy needs for power, heating and transport based on 2008 demand, according to the study by the UN’s Intergovernmental Panel on Climate Change, or IPCC. In practice, less than 2.5 percent of that potential will be used, the panel said, basing the finding on four scenarios out of 164 examined in the UN’s biggest assessment of alternative energy. A shift to low-carbon energy will require a global investment of as much as $12.3 trillion by 2030, it said. “This study will establish itself as ‘the bible’ of renewable energy for the coming years,” said Sven Teske, renewable energy director of Greenpeace International and a lead author of the report. “It’s one of the most comprehensive surveys of all the different technologies and their costs.”
Climate Change: Report Offers Strategies To Adapt. I fear we're going to have to find some creative ways to adapt to a warmer, drier (yet stormier) climate in the decades to come. The San Francisco Chronicle has a story focused on adaptation in the Bay Area: "The Bay Area must start prepping for the whens, not the ifs, of climate change - like building cooling centers for use during heat waves, propping up homes on stilts in flood-prone areas and even abandoning roadways vulnerable to sea-level rise, according to an influential urban policy organization. In a dramatic new tack that emphasizes adaptation over prevention, the San Francisco Planning and Urban Research Association is recommending in a report to be released today that officials in the nine-county region begin making concrete plans for the economic, environmental and public health impacts of increasing temperatures, more volatile weather, scarcer freshwater, rising seas and poorer air quality over the next 100 years."

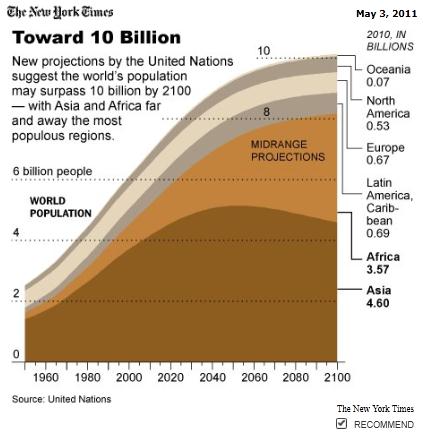
U.N. Forecasts 10.1 Billion People By Century's End. An update from the New York Times: "The population of the world, long expected to stabilize just above 9 billion in the middle of the century, will instead keep growing and may hit 10.1 billion by the year 2100, the United Nations projected in a report released Tuesday. Growth in Africa remains so high that the population there could more than triple in this century, rising from today’s one billion to 3.6 billion, the report said — a sobering forecast for a continent already struggling to provide food and water for its people. The new report comes just ahead of a demographic milestone, with the world population expected to pass 7 billion in late October, only a dozen years after it surpassed 6 billion. Demographers called the new projections a reminder that a problem that helped define global politics in the 20th century, the population explosion, is far from solved in the 21st. “Every billion more people makes life more difficult for everybody — it’s as simple as that,” said John Bongaarts, a demographer at the Population Council, a research group in New York. “Is it the end of the world? No. Can we feed 10 billion people? Probably. But we obviously would be better off with a smaller population.”
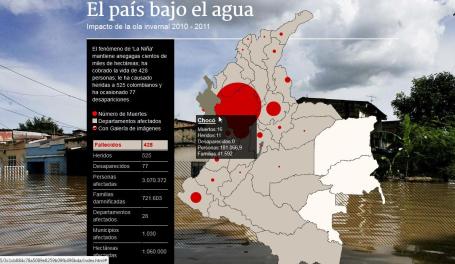
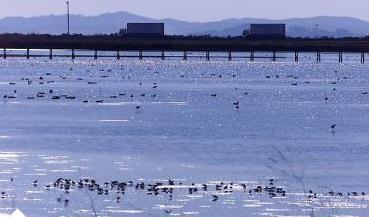
More Extreme Flooding In Columbia. My Spanish is not very good, but a friend and colleague (climate scientist Kevin Trenberth) translated this for me: 2 record flood seasons in a row in Columbia, being linked to the La Nina cooling of Pacific Ocean water, which has thrown a meteorological monkey-wrench into the weather patterns downwind across much of North, Central and South America. Other factors may be loading the dice in favor of more extreme flood events, including the 4% increase in water vapor observed worldwide. A few statistics for Columbia:
Summarizing from Wednesday's edition of "El Espectador":
Deaths: 428
Wounded: 525
Missing: 77
Affected persons: 3,070,372
Homeless families: 721,603
Affected Departments (States): 28 out of 32. Affected towns: 1,030 Number of affected Hectares: 1,060,000
No comments:
Post a Comment