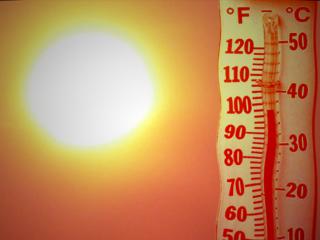
Excessive Heat Warning posted for Hennepin and Ramsey Counties today: highs in the mid to upper 90s coupled with a predicted dew point of 75-80 will make it feel like 105-108 by late afternoon. The risk of heat exhaustion and heat stroke will be significant later today. Take it easy out there.
Extreme Humidity Statistics. Since 1945 the Twin Cities has experienced only 20 hours with a dew point temperature of 80 or higher. The all-time record: 81, set in 1999.
Guam, With Lakes. The "low" temperature (minimum reading) may not drop below 80 F. in the downtowns tonight.

Saturday: nicest day of the holiday weekend? High pressure directly overhead, a fresh breeze from the northwest, lower humidity, highs in the 80s? Saturday may just wind up being early July (the way it was meant to be).
Sunday: clouds increase, best chance of T-storms late in the day and Sunday night. Temperatures: a few degrees cooler.
4th of July: Some morning/midday sun, but conditions may be ripe for another round of T-storms, especially late in the day. Yep, a few atmospheric firecrackers, right on schedule. Could have predicted that months ago...

“...The climate of the 2000s is about 1.5 degree F warmer than the 1970s, so we would expect the updated 30-year normals to be warmer,” said Thomas R. Karl, L.H.D., NCDC director. Article on the new NOAA "normals" below.
* 2010 one of the 2 warmest years ever recorded, worldwide. NOAA has details below.
URGENT - WEATHER MESSAGE
NATIONAL WEATHER SERVICE TWIN CITIES/CHANHASSEN MN
959 PM CDT WED JUN 29 2011
...HOT AND HUMID CONDITIONS ON THURSDAY...
.A HOT AND MUGGY AIR MASS WILL MOVE INTO THE AREA BY DAYBREAK THURSDAY AND CONTINUE THROUGH THE DAY AND INTO THE NIGHT. HIGH TEMPERATURES MAINLY IN THE MID 90S...ALONG WITH SURGING DEW POINTS EXPECTED TO CLIMB WELL INTO THE 70S...WILL CREATE HEAT INDEX VALUES OVER 100 DEGREES THURSDAY AFTERNOON AND EARLY EVENING.
TEMPERATURES WILL REMAIN IN THE 70S THROUGH MUCH OF THE OVERNIGHT ON THURSDAY NIGHT. THE INNER DOWNTOWN AREAS OF THE METRO WILL BE THE MOST SUSCEPTIBLE TO THE HOT AND HUMID CONDITIONS...INCLUDING THE HEAT LASTING INTO THE NIGHTTIME HOURS.
HENNEPIN-RAMSEY-INCLUDING THE CITIES OF...MINNEAPOLIS...ST. PAUL
959 PM CDT WED JUN 29 2011
...EXCESSIVE HEAT WARNING REMAINS IN EFFECT FROM NOON THURSDAY TO 7 AM CDT FRIDAY...
* TEMPERATURE...HIGHS IN THE 90S ON THURSDAY WITH A HEAT INDEX
FROM 100 TO 106 IN THE AFTERNOON AND EARLY EVENING...AND
REMAINING ABOVE 75 DEGREES THROUGH EARLY FRIDAY MORNING.
* IMPACTS...THESE HOT AND HUMID CONDITIONS WILL LEAD TO A
HEIGHTENED RISK OF HEAT RELATED STRESS AND ILLNESSES. THIS
WILL BE ESPECIALLY TRUE FOR THE CENTRAL URBANIZED AREAS OF THE
TWIN CITIES METRO.
PRECAUTIONARY/PREPAREDNESS ACTIONS...
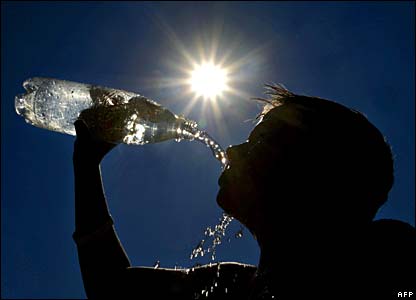
AN EXCESSIVE HEAT WARNING MEANS THAT A PROLONGED PERIOD OF DANGEROUSLY HOT TEMPERATURES WILL OCCUR. THE COMBINATION OF HOT TEMPERATURES AND HIGH HUMIDITY WILL COMBINE TO CREATE A DANGEROUS SITUATION IN WHICH HEAT ILLNESSES ARE LIKELY. DRINK PLENTY OF FLUIDS...STAY IN AN AIR-CONDITIONED ROOM...STAY OUT OF THE SUN...AND CHECK UP ON RELATIVES AND NEIGHBORS.
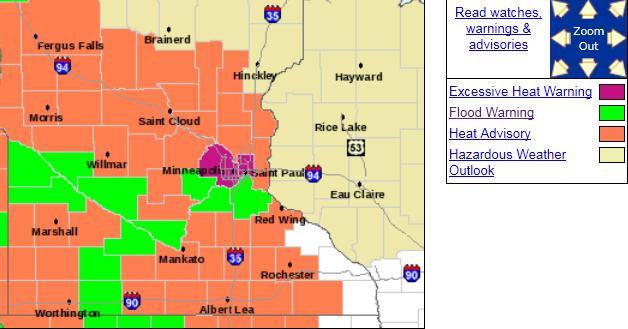
Excessive Heat Warning. The "urban heat island" will amplify and magnify the heat today (all that asphalt and concrete adds another 5-10 degrees on a day like this). Heat advisories are posted for most of central and southern Minnesota, flood warnings remain in effect for the Minnesota River. More from the NWS here.
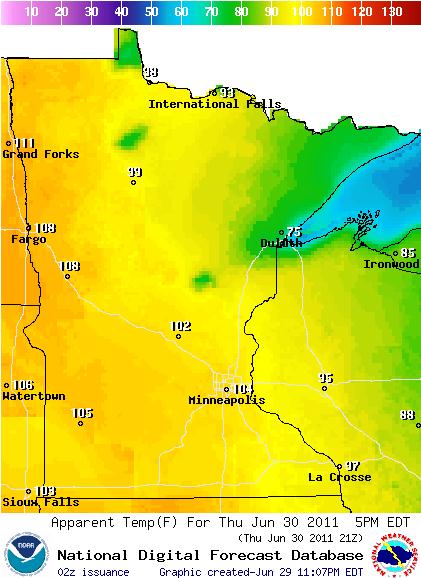
Heat Index. Leave to a meteorologist to leave you feeling more miserable than you thought possible. In the winter and early spring it's wind chill. Today it's the "heat index", what it actually feels like out there, factoring temperature and dew point. The concept is simple: your body cools itself naturally by sweating. Evaporation of sweat off your skin has a cooling effect (that's why you feel chilled stepping out of the shower). But when dew points are in the 70s to near 80, when there's this much water already in the air, your body can't cool itself by sweating. It's much easier to overheat. The predicted heat index at 4 pm today is forecast to range from 104 in the Twin Cities to 105 at Marshall, 108 at Alexandria and Moorhead. Pass the A/C please.

Holiday Weekend Preview:
Today will be the hottest day in sight, highs well up into the mid/upper 90s with a heat index of 105 by mid afternoon. A cooler front arrives Friday, winds shift to the northwest, pumping slightly cooler/drier Canadian air into Minnesota late Friday into Saturday. Right now Saturday looks like a fine, summer day with highs in the 80s, enough sun for a respectable burn. Friday's cool front will run out of steam, stalling to our south, a wave of low pressure rippling along that stalled frontal boundary sparking scattered T-storms Saturday night into Sunday (best chance over central and southern Minnesota). Some clearing is possible by Monday, the 4th, a better chance of sunshine and highs in the 80s. Right now Sunday still appears to be the wettest day (best chance of T-storms by late afternoon/evening).
Saturday: West/Northwest breeze at 10-15 mph. Dew point: 60-63. Highs: 80s.
Sunday: Southeast breeze at 8-12 mph. A few degrees cooler: low to mid 80s. T-storms late?
Monday (4th): Southeast breeze at 5-10 mph. Mid 80s. A few scattered T-storms.
Saturday Outlook. A weak bubble of high pressure draped over Minnesota should keep the sun out much of the day Saturday, a cool frontal boundary sparking heavy showers and T-storms from Milwaukee and Chicago to the Quad Cities. Right now Saturday looks (unusually) nice - for a holiday.
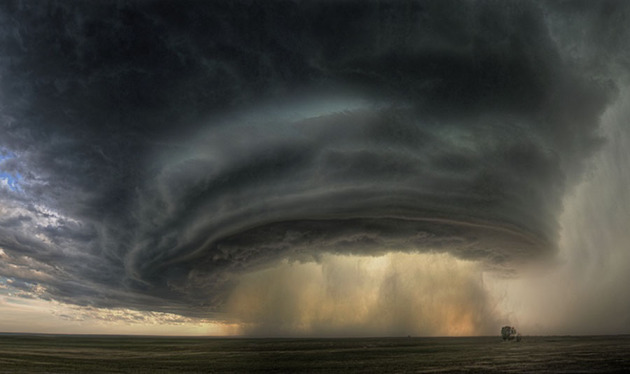
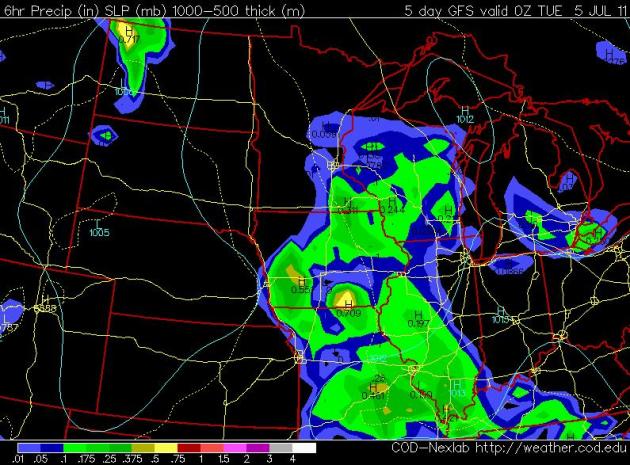
Sunday Evening: Thunder Potential. The GFS solution shows T-storms popping across much of central and southern Minnesota Sunday afternoon/evening, locally heavy rain possible (especially south/west of the Twin Cities). Your best odds of salvaging a few hours of dry weather Sunday: morning and midday hours. More clouds and scattered showers will probably keep temperatures a few degrees cooler.
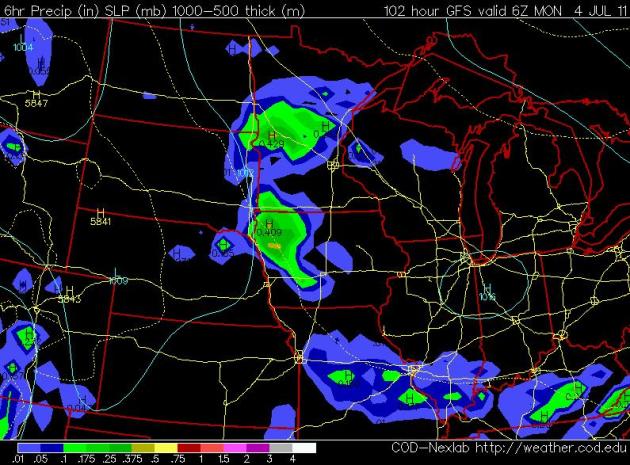
Monday: 4th Of July Atmospheric Firecrackers? The GFS model shows the best chance of Monday evening T-storms south and east of St. Cloud, from Duluth southward through the Twin Cities to Albert Lea and Rochester. Skies may remain mostly-dry over far western and northern Minnesota, but this far out? I wouldn't bank on anything. No all-day rains Monday - the best chance of T-storms late in the day, evening and early nighttime hours.
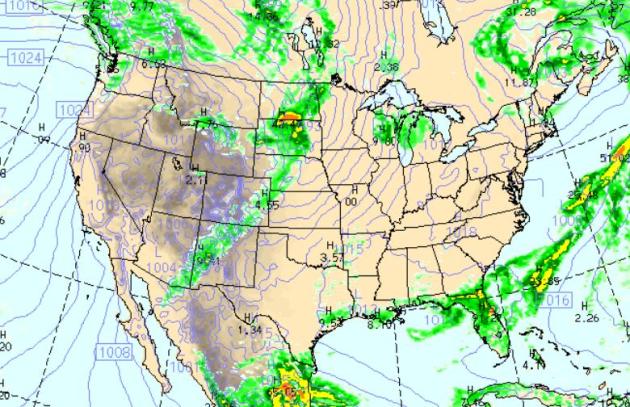
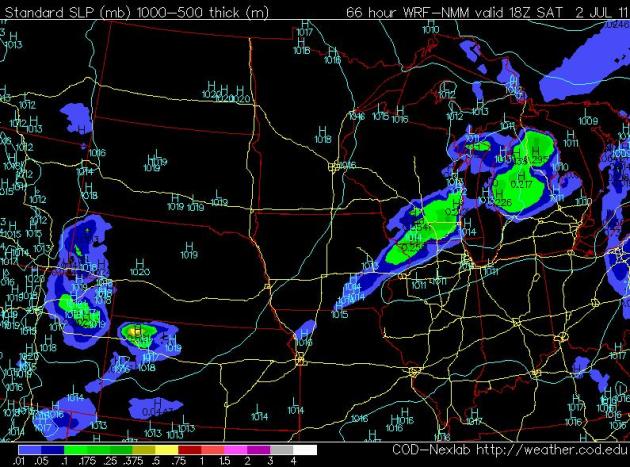
Thursday Weather Map. Showers and heavy T-storms linger over Florida (great news for the drought-stricken state). Much of the east should be sunny and dry, extreme heat surging north across the Plains into the Twin Cities. A line of strong/severe storms may pop across the western Plains late in the day, a few storms over the Dakotas may turn severe. Meanwhile the west remains dry - still unseasonably cool, a few light showers for Seattle. WRF/NAM model forecast map above valid at 7 pm this evening.
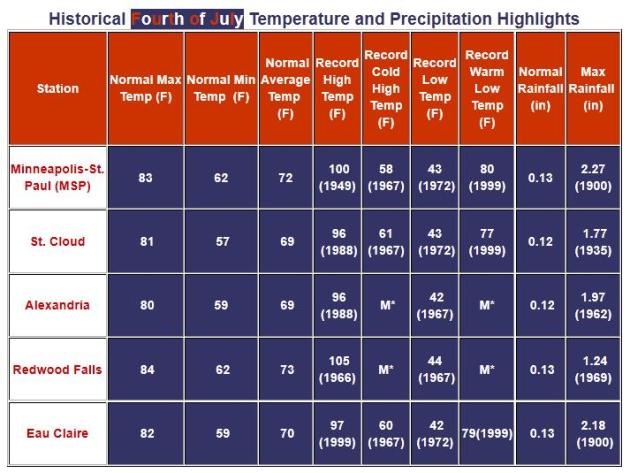
More memorable Independence days, weather-wise, include:
*1972: Record low temperatures in the 40's were set in many locations
*1967: Record cold low and high temperatures set across much of the area
*1900: Over 2 inches of rain fell in the Twin Cities and Eau Claire
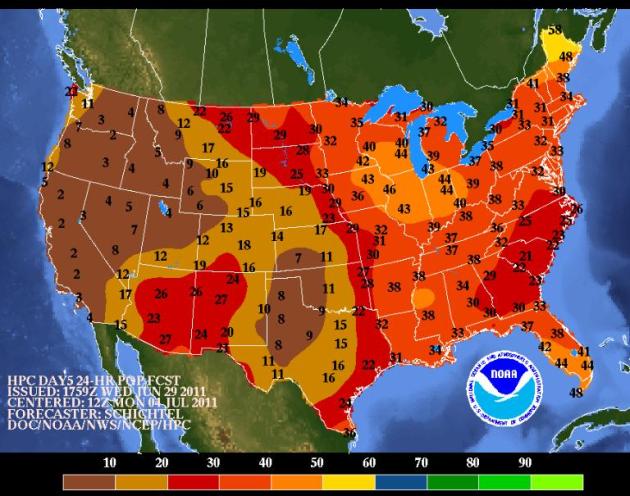
Probability Of Precipitation On July 4. Dry weather is likely out west and across the southern Plains states, the best chance of scattered T-storms across the Upper midwest and Ohio Valley. The risk of T-storms is 42% in the Twin Cities, 35% at Duluth, less farther west across the Dakotas.
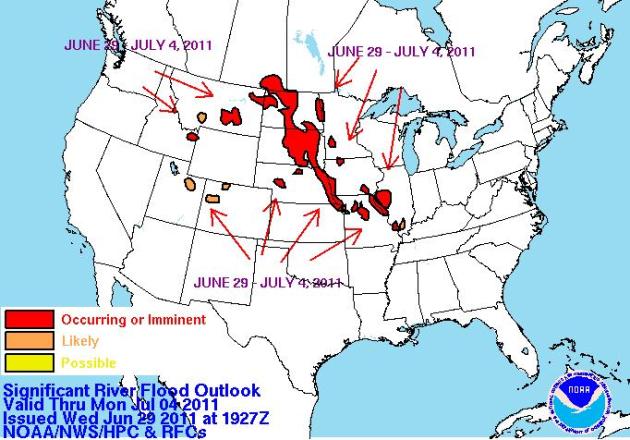
USA Flood Outlook. The latest graphic from NOAA's NCEP division is here - extensive flooding underway from the Dakotas southward to Missouri. Rapid snow melt coupled with sudden warmth and rain showers are producing flooding problems for the central and northern Rockies as well.
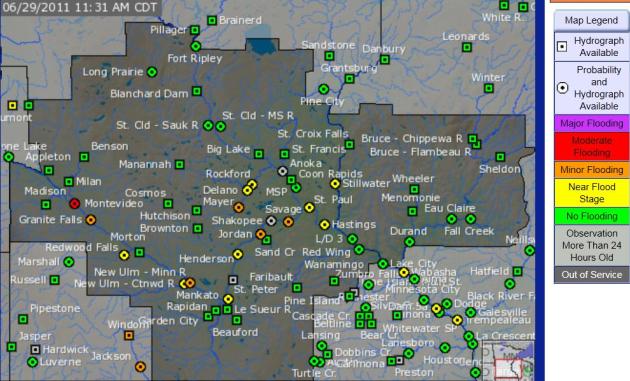
Minnesota Flood Update. Minor flooding is being reported along the Minnesota River, but moderate flooding is taking place in Montevideo. Click here to see all the details, courtesy of the National Weather Service.
Is Deluged Minot, North Dakota Ready For Drought? What's that old saying? "Only in North Dakota can you be ankle-deep in mud with dust blowing in your face." The extremes are pretty staggering - once the flood waters recede residents of North Dakota may be dealing with drought conditions. Unbelievable. The New York Times reports: "Mayor Curt Zimbelman of Minot, N.D., sat in his office yesterday for the first time in more than a week after battling the worst flood of the Souris River his town has seen since 1881. Zimbleman oversaw an emotional, voluntary evacuation of his town when the crests last week were forecast to be 7 feet higher than they have ever been. He has taken numerous helicopter rides to survey the inundation's damage. He is overseeing a secondary levee that is holding water back for emergency vehicles and trying to find shelter for Minot's 11,000 displaced people. Zimbelman said he knows climate change could create more flooding and even drought someday in his city. But he is not thinking about that now. "It's complete devastation. Most of these houses are up to the rooftops," Zimbelman said, recounting his observations from hours spent at the emergency center and surveying the damage by helicopter. "Right now we're just focused on getting through the immediate disaster." This year, record amounts of snow and rainfall resulted in unprecedented flooding of the Souris and Missouri rivers, wreaking millions of dollars in damages in North Dakota towns like Minot and states throughout the Midwest. The U.S. Army Corps of Engineers braced for crisis along the Souris on Father's Day, with severe flooding setting in June 24. Last weekend the river crested, some areas reaching 14 feet above flood level."
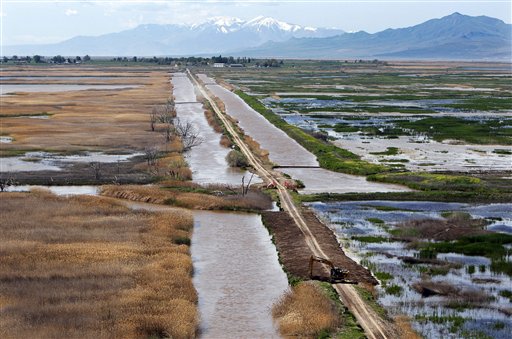
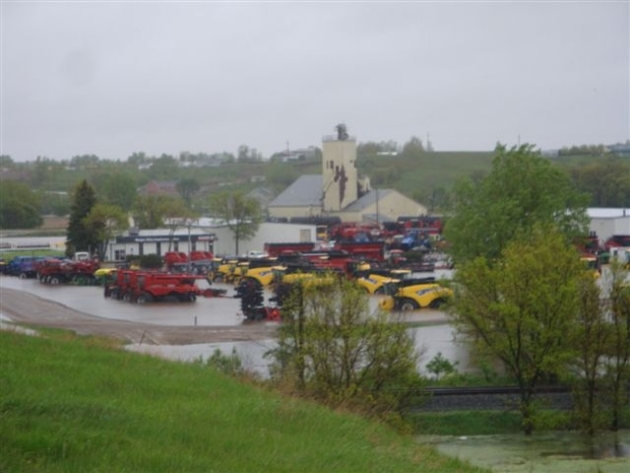
Utah Flood Risk Remains High, Fire Danger Peaks. It may be a short-term peak in the fire situation across Utah, but prime-time for wildfires is late summer and early autumn. The Salt Lake Tribune has the latest: "As potential climatic crises go, forecasters are serving up an eclectic repast: overflowing rivers and creeks in northern Utah, tinder-dry high desert ranges to the south and high winds throughout the state. In northern Utah, the National Weather Service left flood warnings in place for Cache County’s Logan River and Spring Creek; the Weber River in Weber and Summit counties; and the Duchesne and Green rivers in the eastern part of the state. Salt Lake County’s Little Cottonwood Creek started Wednesday at “bank full,” though floodwatchers believed the worst was over. Creek monitors expected it to rise to near or at flood stage by early Thursday morning before once again retreating. Residents of Providence, where sandbag barriers had been reinforced late Tuesday against an expected overnight peak flow at Spring Creek, were breathing easier with the coming of dawn Wednesday. “Last night went very well,” said Randy Eck, public works director for Providence. “The anticipated [flooding] levels were not reached overnight. I don’t know why, but I’m not going to ask, either. I’m just very thankful.” (photo courtesy of cfnews13.com)
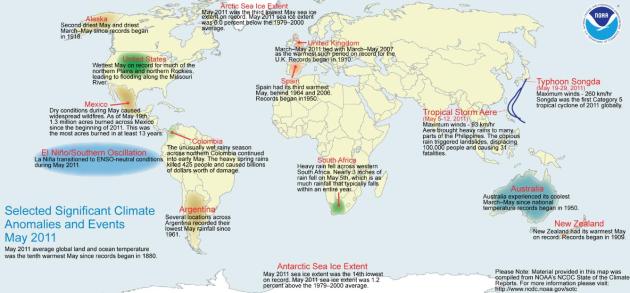
Global May Weather Highlights. Click here to see some of the weather and climate highlights (low-lights) for May. The USA experienced the wettest May on record across the Northern Plains and Northern Rockies, contributing to historic flooding now underway on the Missouri River.
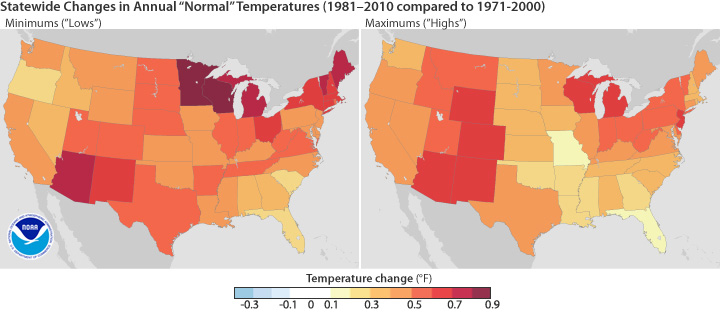
Average U.S. Temperature Increases By .5 F. The new 30 year "normals" are about to be released by NOAA; here's a preview: "According to the 1981-2010 normals to be released by NOAA’s National Climatic Data Center (NCDC) on July 1, temperatures across the United States were on average, approximately 0.5 degree F warmer than the 1971-2000 time period. Normals serve as a 30 year baseline average of important climate variables that are used to understand average climate conditions at any location and serve as a consistent point of reference. The new normals update the 30-year averages of climatological variables, including average temperature and precipitation for more than 7,500 locations across the United States. This once-a-decade update will replace the current 1971–2000 normals. In the continental United States, every state’s annual maximum and minimum temperature increased on average. “The climate of the 2000s is about 1.5 degree F warmer than the 1970s, so we would expect the updated 30-year normals to be warmer,” said Thomas R. Karl, L.H.D., NCDC director. Using standards established by the World Meteorological Organization, the 30-year normals are used to compare current climate conditions with recent history. Local weathercasters traditionally use normals for comparisons with the day’s weather conditions.
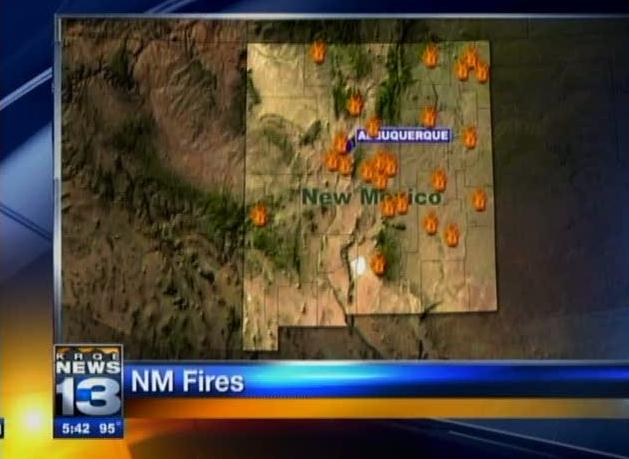
Wednesday In New Mexico: 24 New Fires In 24 Hours. KRQE.com has the details: "2011 is the busiest,the most destructive fire season since records started being kept. Twenty-four new fires in twenty-four hours and other fires from around the state add to the record."
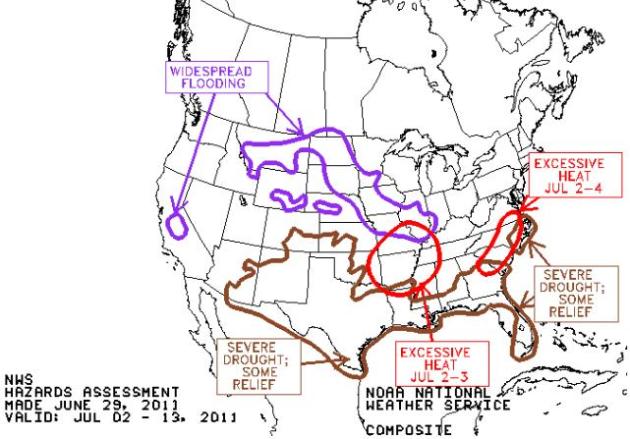
Next Week. According to NOAA flooding will continue to be a major concern from Montana and the Dakotas southward to Missouri, extreme heat from the Middle Mississippi River Valley to the Carolina, while extreme drought conditions grip much of the south.

"Mini-Tsunami" Hits England, Triggered By Underwater Landslide. This YouTube clip caught my eye - a surge of water (apparently) triggered by a landslight off the coast of the U.K. Amazing.
Tropical Storm Arlene. Packing 50 mph winds, "Arlene" is the first tropical storm of the season, tracking due west into Mexico, where it may drop some 10-15" rains in the next 1-2 days. Satellite loop courtesy of NOAA and Mike's Weather Page.
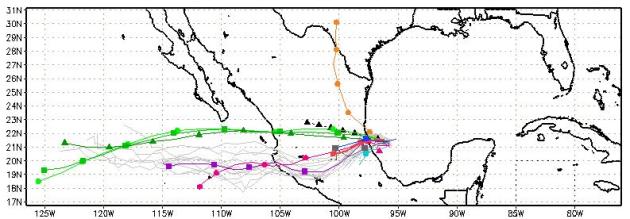
Projected Track. The soggy remains of "Arlene" are forecast to track due west, only one model pulls the storm north into Texas, where locals are probably praying for a tropical soaking (preferably not a hurricane). Data courtesy of NHC.
Crazy Extremes Continue Across the USA...
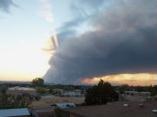
Los Alamos Wildfire Update. As of late Wednesday flames had consumed over 70,000 acres of land around the Los Alamos nuclear lab. The blaze is only 3% contained. KOB-TV has more details here.
- Los Alamos National Laboratory announced it will remain closed through Friday because of risks presented by the Las Conchas Fire and the mandatory evacuation of Los Alamos town site.
- The Las Conchas fire has not jumped the highway and entered Technical Area 16 on the lab’s southwestern boundary.
- Only one fire has been sparked at LANL, and it was less than an acre and put out quickly.
- Santa Fe National Forest and Valles Caldera National Preserve will close the majority of the Forest and Preserve to all public access starting Thursday. Many state parks and wildlife areas closed as well.
- Governor Susana Martinez declared a State of Emergency in New Mexico through July 6th regarding the use of fireworks. While State law does not allow the Governor to ban fireworks by executive order, she is urging all New Mexicans to refrain from buying, selling, or using fireworks during the dry summer fire season and has instructed the Department of Public Safety to increase staffing of officers and coordination with local law enforcement agencies to enforce all statewide and local fireworks bans or restrictions.
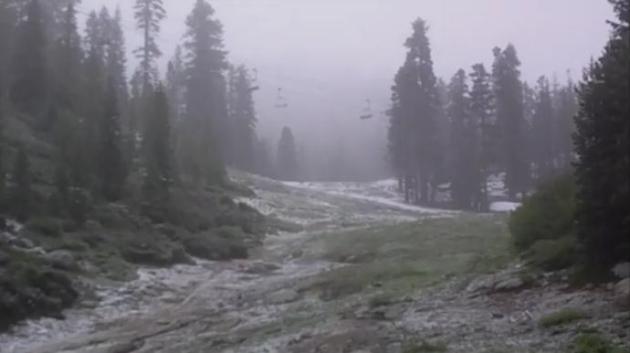
Snow In Lake Tahoe Area, On June 29! Check out this YouTube video taken yesterday - enough snow to coat the ground. What summer?
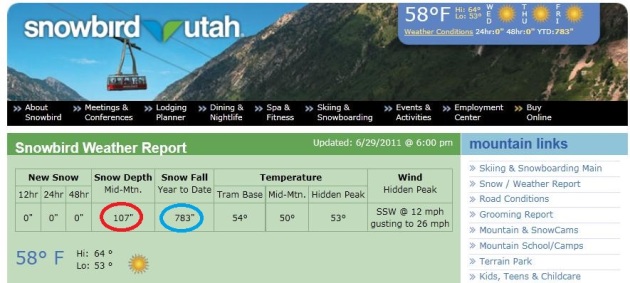
4th Of July Skiing At Snowbird. Tired of picnics, grilling and fireworks? Consider a little downhill skiing or snow-boarding on the 4th of July. Unbelievable. 783" snow so far this super-sized "winter season", with a whopping 107" of snow still on the ground mid-mountain. The mind-boggling details are here. No, you can't make this stuff up.
- Lake Tahoe woke up to snow above 7300 feet.
- This is the second snow of June.
- It has been over 12 years since it has snowed every month of the year but it does happen. This could be one of those years.
- Even with the melt accelerating fast, enough upper-elevation snowpack remains for Snowbird Ski & Summer Resort to stick with plans to extend the ski season through the Fourth of July.
- Lasting through Monday would give Snowbird a 202-day season — its longest ever.
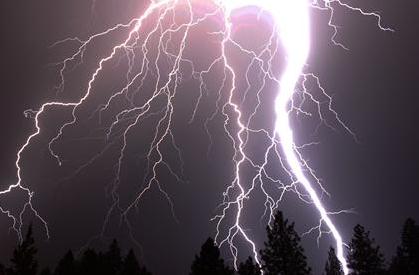
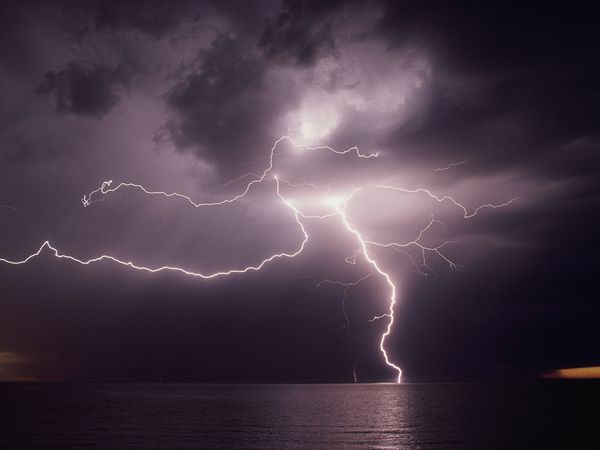
Lightning Kills 18 Students, Teacher in Uganda. USA Today has the story: "A lightning strike on a primary school in Uganda killed 18 students and their teacher and injured 36 other pupils, according to news reports. Two other people died in separate lightning strikes elsewhere in the African nation. In the past week, a wave of lightning strikes has killed a total of 31 Ugandans. A government meteorologist said the electrical storms have resulted from "an unusual" surge of moist air flowing from the Atlantic Ocean and through the Congo Basin, combined with dry spells, the Daily Monitor reports. The country's top disaster-preparedness official blamed the deaths on a lack of lightning rods, which are required under building codes. "Over the years, there has been a reluctance to enforce these building codes. It is until now that we have realized that many schools and health centers do not have these conductors," said Musa Ecweru, minister of state for disaster preparedness. "Yes, there has been negligence on the part of those who certify buildings are fit for public use."
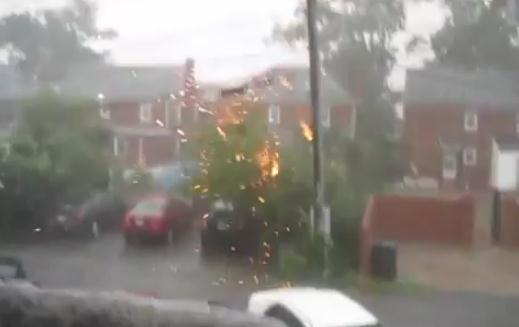
Close Call. This woman is lucky to be alive. She was shooting video outside her window of an electrical storm, when a cloud to ground strike hit a pole and transformer less than 30 feet from where she was standing. This is why it's probably not a good idea to stand next to a large window during a thunderstorm. Check out the YouTube footage. Details: "I shot this last night during a storm in Richmond, VA. I got first degree burns on my forehead from the heat of the blast. Enjoy!!"

Man Hit By Lightning For The 6th Time. Talk about redefining the meaning of "bad luck"! WYFF.com has the remarkable story. Best not to hang too close to this guy: "SENECA, S.C. -- An Upstate man has again disproved the old adage about lightning never striking the same place twice after being struck for the sixth time on Monday.Melvin Roberts, 58, is recovering at Oconee Memorial Hospital after being struck at his home on Deer Park Drive in Seneca on Monday.His wife, Martha Roberts, said that her husband was outside trying to cover his lawn mower when he was struck. Neighbors found Roberts lying unconscious in the yard.Melvin Roberts said he was struck several times over the last several years, and in the last case in 2007, it was not even raining when it happened.Robert said, "I went to cover my chickens up, and I believe it was clear. But when I woke up, I was all bloody and burned and confused and had my little chickens lying with their feet up."Roberts carries a scar on his head from the first time and scars on his legs from the 2007 strike. That strike left him with nerve damage to his left leg and he spent more than a year in a wheelchair.This time he has a wound on his foot and blisters on his ankles."
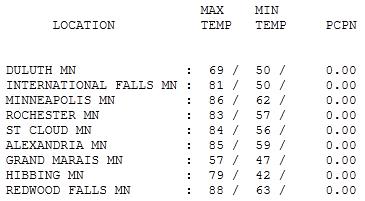
Prime-Time Summer Time. Wednesday was the opening act: enough sun for 84 at St. Cloud, 86 in the Twin Cities and 88 at Redwood Falls. A breeze off Lake Superior kept the high down to 69 at Duluth. No rain fell statewide.
Paul's SC Times Outlook for St. Cloud and all of central Minnesota:
TODAY: Heat Advisory. Hot sun much of the day, gusty Feels like 100-105+ Winds: S 15-30 High: 94. (dew point in the 70s to near 80 will make it feel like 105-108 later today)
THURSDAY NIGHT: Unseasonably warm, T-storms possible mainly over northern and western MN. Low: 74
FRIDAY: Still hot, turning less humid late with plenty of sun. High: 91
SATURDAY: Best day of the holiday weekend? Warm sun, breezy, less humid. Winds: NW 10-15. High: 86
SATURDAY NIGHT: Clouds increase, a few T-storms possible late (mainly southern Minnesota). Low: 66
SUNDAY: More clouds than sun, more humidity. Few T-storms possible. Winds: SE 8-13. High: 83
MONDAY (4th of July): Partly sunny and warm, T-storms popping up, especially PM hours. Winds: SE 8-13. High: 84
TUESDAY: Leftover showers early, slow clearing. Low: 70. High: 86
WEDNESDAY: High pressure, warm blue sky. Low: 66. High: 83

Hot Front
Our on-again, off-again summer is most definitely on-again. Super-heated air direct from Texas will boost the mercury into the mid 90s today; 100 is not out of the question. Unlike June 7, when the mercury hit 103 and dew points were in the 50s, the latest NAM model pumps the dew point up to a dreadful 80 F. by evening. That means the "heat index" will be in the 105-108 F. range later today. The Weather Service has issued an Excessive Heat Warning for the Twin Cities today, a Heat Advisory for all of central MN; take it easy out there - think cool thoughts.
Good news: today's "heat storm" will be brief; winds shift to the northwest Friday; you'll notice a dip in humidity by Saturday.
Keep your weather-expectations low and you'll never be disappointed, right? Saturday looks fine: 83-88 F, plenty of sun, a fine summer day. Friday's cool front will stall over Iowa, setting the stage for a few T-storms late Sunday, especially central & northern counties. Sunday appears to be the wettest day, but not a total wash-out. A few pop-up T-storms are likely late on the 4th, but much of the day should be dry and picnic-friendly. Yes, my nervous tick is back. Holidays do that. The good news: 80s will feel great. Just watch for a few T-storms Sunday, again late Monday.
Climate Stories...
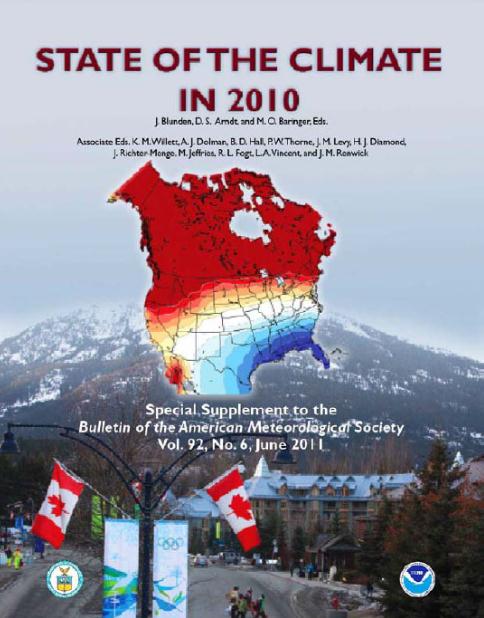
Impact Of "ENSO" On Climate System: 2010 One Of The Two Warmest Years On Record: Here's an excerpt of an article from NOAA: Worldwide, 2010 was one of the two warmest years on record according to the 2010 State of the Climate report, which NOAA released today. The peer-reviewed report, issued in coordination with the American Meteorological Society, was compiled by 368 scientists from 45 countries. It provides a detailed, yearly update on global climate indicators, notable climate events and other climate information from every continent. This year’s report tracks 41 climate indicators ― four more than last year ― including temperature of the lower and upper atmosphere, precipitation, greenhouse gases, humidity, cloud cover, ocean temperature and salinity, sea ice, glaciers, and snow cover. Each indicator includes thousands of measurements from multiple independent datasets that allow scientists to identify overall trends. While several well-known cyclical weather patterns had a significant influence on weather and climate events throughout the year, the comprehensive analysis of indicators shows a continuation of the long-term trends scientists have seen over the last 50 years, consistent with global climate change. “We’re continuing to closely track these indicators because it is quite clear that the climate of the past cannot be assumed to represent the climate of the future. These indicators are vital for understanding and making reliable projections of future climate,” said Thomas R. Karl, L.H.D, director of NOAA’s National Climatic Data Center in Asheville, N.C. Last year was marked by important climate oscillations like the El Niño-Southern Oscillation and the Arctic Oscillation, which affected regional climates and contributed to many of the world’s significant weather events in 2010.
Highlights of some of the climate indicators include:
- Temperature: Three major independent datasets show 2010 as one of the two warmest years since official record-keeping began in the late 19th century. Annual average temperatures in the Arctic continued to rise at about twice the rate of the lower latitudes.
- Sea Ice & Glaciers: Arctic sea ice shrank to the third smallest area on record, and the Greenland ice sheet melted at the highest rate since at least 1958. The Greenland ice sheet melt area was approximately 8 percent more than the previous record set in 2007. Alpine glaciers shrank for the 20th consecutive year. Meanwhile, average sea ice extent in the Antarctic grew to an all-time record maximum in 2010.
- Sea Surface Temperature and Sea Level: Even with a moderate-to-strong La Niña in place during the latter half of the year, which is associated with cooler equatorial waters in the tropical Pacific, the 2010 average global sea surface temperature was third warmest on record and sea level continued to rise.
- Ocean Salinity: Oceans were saltier than average in areas of high evaporation and fresher than average in areas of high precipitation, suggesting that the water cycle is intensifying."

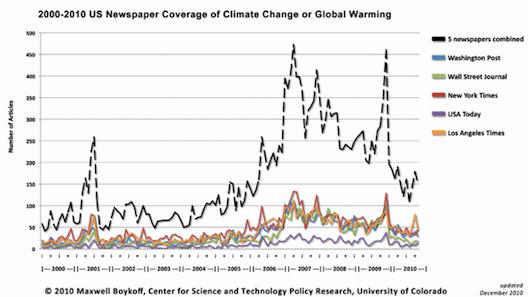
Media coverage of climate change in 2010 slipped to levels not seen since 2005, after spiking in in late 2009 in the run-up to the much-hyped United Nations climate talks in Copenhagen and the release of private emails from climate scientists stored on a English university server.
Analysis of DailyClimate.org’s archive of global media coverage shows that journalists published 23,156 climate-related stories in English last year — a 30 percent drop from ’09′s tally.
Those stories came from 8,710 different reporters, columnists and editorial writers at 1,552 different media outlets. Last year, according to the Web site’s database, more than 11,000 reporters tackled the subject – a 22 percent drop for 2010.
Despite the trend, some outlets and reporters remain prolific. Reuters again lead the pack, publishing 1,683 stories last year – 4.6 stories a day. The New York Times had 1,116; the London Guardian, 941; the Associated Press, 793.
But for network news and other mainstream outlets, the trend was down, down, down."
No comments:
Post a Comment