Drearily Productive
Along
comes breaking (shocking!) news that, given a choice between locating
that new business in a gray, dreary northern location or the
sun-drenched southwest, it might make more dollars and sense to set up
shop Up North. Really.
Recent studies
at Harvard and The University of North Carolina - Chapel Hill confirm
that workers are more productive on rainy days. Blue-bell days were
distracting, with more work-related errors. Details on the blog. You're
telling me there's a good reason I have a company in the Twin Cities
vs. Phoenix or L.A.?
What the report didn't mention: if the weather is too lousy it's hard to attract great people.
I
tell my new recruits the truth: Minnesota's coldest days (which aren't
that cold anymore) tend to be sunny, which takes some of the sting out
of those cold fronts. Rationalizing the chill? Perhaps. I'm not above
trying that...
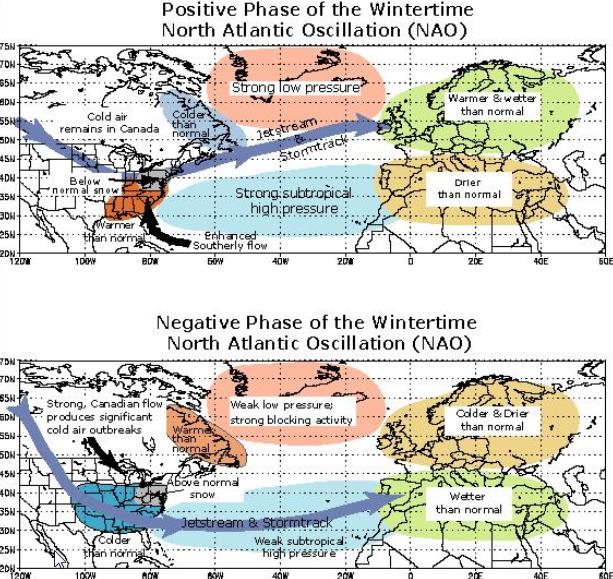
We're heading into a warmer, positive phase of the
North Atlantic Oscillation, which may tip the odds in favor of more rain
than snow the next 1-2 weeks.
Not exactly Indian Summer but 50s
will feel good today, followed by a slight cooling trend Saturday - near
50F again Sunday. A light mix may brush MSP on Tuesday. The European
model hints at a cold rain on Halloween.
Great timing.
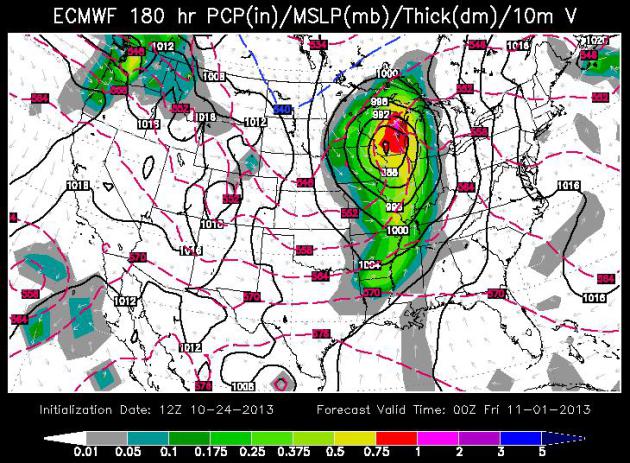
Soggy Halloween?
Speaking of the ECMWF, here is the solution for next Thursday evening,
Halloween 2013, showing a significant storm near La Crosse or Madison,
pulling moisture from the Gulf of Mexico north. This is hardly gospel -
the forecast will inevitably change in the days ahead, but if this comes
close to verifying the Midwest, Great Lakes and Mississippi Valley can
expect some very soggy Trick or Treat conditions, along with the Pacific
Northwest. Map above courtesy of
WSI Corporation.
A Stormier Pattern.
The loop above shows GFS guidance, spinning up a series of storms over
the Plains in the coming days, possibly a significant storm for the
Midwest in time for Halloween. Rain? Probably, but I get very
uncomfortable when a strengthening, cooling storm tracks south/east of
Minnesota in late October. It will depend on the final track, but GFS is
aligning with the (wet) ECMWF solution above. Loop of surface pressure
and 10 meter winds courtesy of NOAA and Ham Weather.
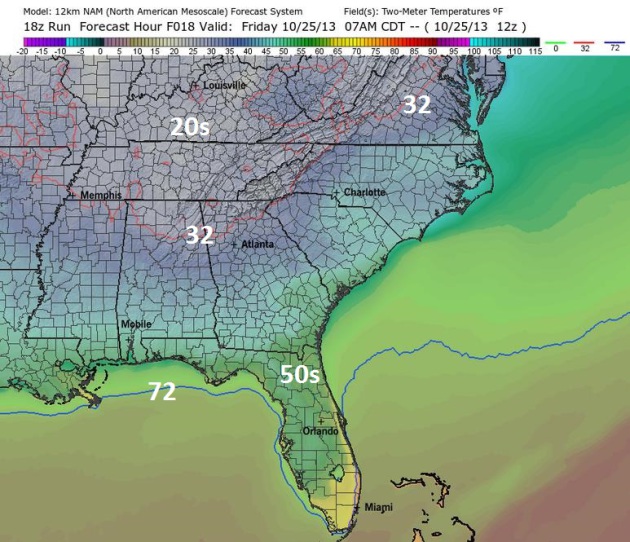
Misery Loves Company.
If it's any consolation, much of America east of the Rockies is feeling
the chill. NAM guidance shows predicted 7 AM temperatures close to
freezing in the northern and western suburbs of Atlanta, 50s pushing
into the Florida Panhandle. Here's a shout-out to Chief Meteorologist
Mike Francis,
who heads up an amazing team of meteorologists at WXIA-TV in Atlanta,
our latest affiliate for WeatherNation TV. We're very proud to be
partnering with 11 Alive.
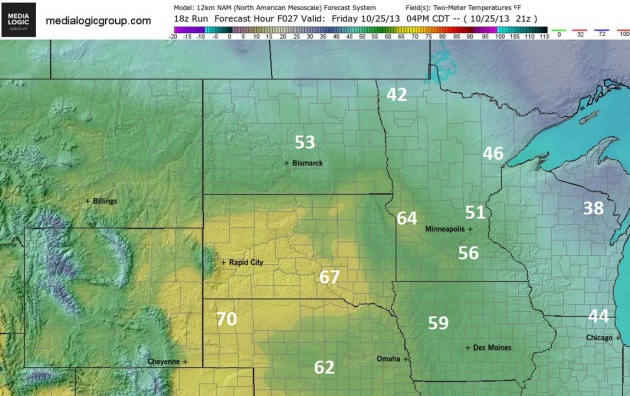
Not Exactly Indian Summer, But Better.
4 pm temperatures derived from the 12 KM NAM model show low to mid 50s
this afternoon in and around the metro area, even some 60s over
southwest and west central Minnesota - about as mild as it's going to
get anytime soon. Map: Ham Weather.
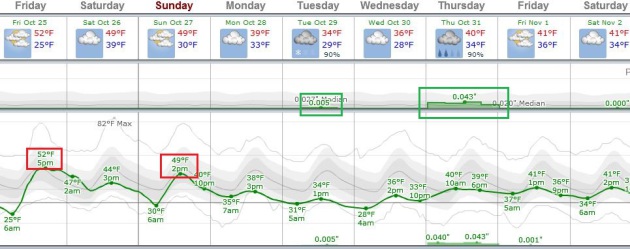
Mild Blip, Followed By A Cool Smack.
Nothing frigid or arctic is brewing, but after a (relatively) mild
today today, again Sunday, we cool well below average again next week. A
storm sliding south of Minnesota my brush southern counties with a
light rain/snow mix Tuesday, a better chance of a cold rain, possibly
mixing with snow, on Halloween. ECMWF numbers above courtesy of
Weatherspark.
What This Winter Is Packing. Thanks to Emily Sohn at
Discovery News for including my inane comments in a story focused on the winter to come. Cue the shrugging and hand-waving arguments: "...
There
are just so many variables, many of which can change in an instant. “A
three-to-six month weather outlook is still more of a horoscope than an
actual scientific prediction -- your horoscope may be a little more
accurate, in fact,” said Paul Douglas, senior meteorologist and
co-founder of WeatherNation TV, a new 24-hour national weather channel.
“To be honest, any forecast beyond two weeks should come with a warning
much like on a pack of cigarettes. In the end, some things are
inherently unknowable.” Among the factors that determine whether a
winter will be lion-like or lamb-like, perhaps the most well known is
the El Niño-Southern Oscillation, also known as ENSO, which describes
shifts in the temperature of surface waters in the Pacific Ocean..."
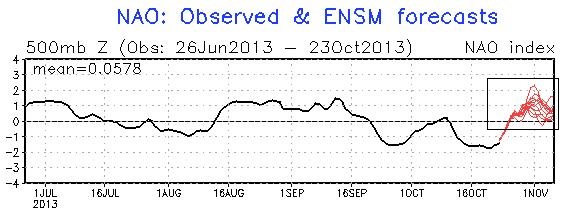
Upward Blip In Temperatures?
Here's the latest trend of the NAO, where we've been and where we (may)
be going. A strong negative phase of the NAO corresponds with colder,
Canadian air having a clear runway to invade the USA (especially east of
the Rockies), which is what we've seen for the past 7-10 days. An
upward trend in the coming days may bring a few highs in the 50s to near
60 in the Twin Cities the latter half of next week - hardly Indian
Summer, but not as harsh as recent days. It should be warm enough aloft
for a potentially significant rain event by the end of next week. Graph:
NOAA NCEP.
North Atlantic Oscillation.
NC State
has a good explanation of the NAO and how, along with ENSO (El Nino and
La Nina) it helps to set the tone for weather across much of North
America. Again, it appears we're heading into a positive (milder) phase
of the North Atlantic Oscillation in the next 1-2 weeks, a slight
(temporary) reprieve from the worst of the wind chill over the northern
USA.
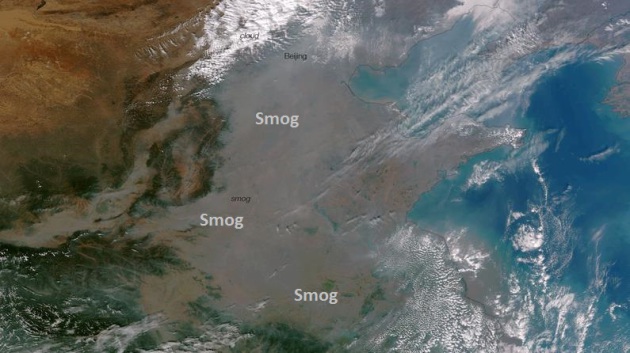
China's Smog As Seen From Space.
The scale of the smog is amazing from a meteorological perspective,
cold (stable) air, a strong inversion layer trapping pollutants near the
ground, covering a huge part of northern and northeastern China.
Details from
NPR: "
We
told you earlier this week about how smog choked the northeast Chinese
city of Harbin, which is home to 11 million people. Today, we get a
stunning look at just how bad the problem is from an image taken by the
Suomi NPP satellite on Tuesday. That murky gray you see below is all
smog..."
Image credit above: "
Heavy smog has
shrouded much of eastern China, and air quality levels have been dropped
to extremely dangerous levels. The heavy smog is caused by industrial
pollution, coal and agricultural burning, and has been trapped by the
mountains to the west and wind patterns. The thick haze of smog is
clearly visible as the murky gray color in this true color satellite
image."
NASA/NOAA.
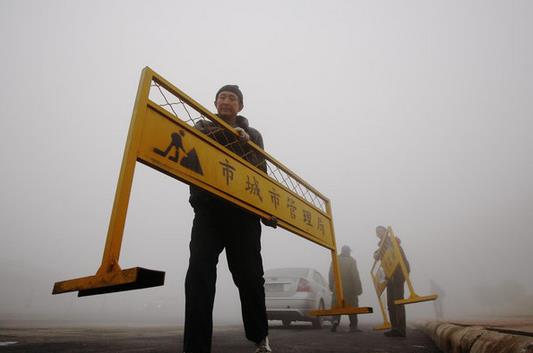
Response To A City's Smog Points To A Change In Chinese Attitude. Because it's pretty hard to hide, dismiss or conceal a 1,000 mile wide stationary toxic cloud. Here's an excerpt from
The New York Times: "...
Action plans in Harbin, Beijing and other cities, along with broad national policies
meant to curb air pollution announced last month, signal that some
officials are serious about tackling the chronic problem. On Thursday,
the Ministry of Environmental Protection said it was sending inspection
teams to cities across China for the winter to ensure that environmental
regulations were enforced. Awareness of various kinds of pollution —
air, water and soil — has risen quickly this year, especially among
middle-class urbanites..."
Photo credit above: Hao Bin/European Pressphoto Agency. "Government workers moved signs to block roads amid heavy fog in Harbin this week."
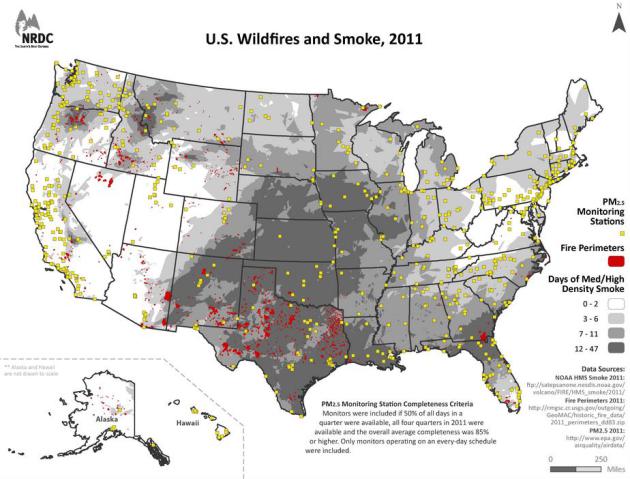
Wildfire Smoke Puts At Risk The Health of Americans Living Far From The Flames. I did a double-take on this story from the NRDC,
The National Resources Defense Council. Here are a couple of noteworthy clips: "...
Today my NRDC colleagues released a report concluding
that wildfire smoke can pose serious health risks to people even
hundreds of miles away from a blaze. That means residents of cities and
suburbs far from forests or grasslands may still be vulnerable to the
asthma attacks, pneumonia, and more serious chronic lung diseases
brought on by smoke....My colleagues looked at data from the 2011
wildfire season and found that two-thirds of Americans—nearly 212
million people—lived in counties affected by smoke. Six states that
didn’t even have major fires that year still had to deal with more than a
week of medium- to high-density smoke conditions. Texas topped the list
of most smoke-affected states, with more than 25 million people living
in places with wildfire smoke conditions for one week or more. Illinois
was second, with nearly 12 million people living in areas with smoky
conditions, and Florida came in third, with more than 11 million..."
Lessons From Sandy.
We're coming up on the one year annniversary of Superstorm Sandy (it
came ashore on October 29, 2012). What were the major take-aways from a
meteorological perspective? What astronomical forces conspired to make
this storm even worse than it should have been. Sea level in New York
City has risen 8-12" in the last 40 years, the result of volumetric
expansion of warming ocean water and melting from glaciers and
Greenland. In today's edition of
Climate Matters we take a look at the factors that made Sandy a 1 in 500 year event.
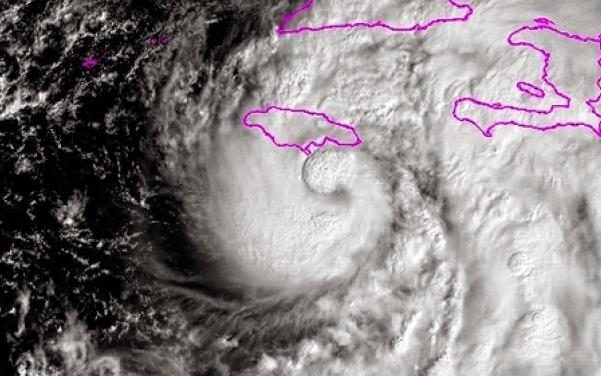
Hurricane History: Sandy And Wilma. Here's an excerpt of a good post marking two tropical anniversaries from Brian McNoldy at
The University of Miami: "
One
year ago this morning, Sandy intensified to a hurricane just south of
Jamaica. By the morning of October 25th, it rapidly intensified to a
Category 3 hurricane with 115mph winds as it made landfall on the
southeastern coast of Cuba. Model guidance was coming into better
agreement on a track that would bring Sandy into the New Jersey coast as
a very large cyclone on October 29th, possibly not tropical, but still
very potent..."
Sandy: One Year Later.
Architectural Record
has an interesting perspective on some of the lessons learned, and what
more needs to be done to mitigate damage from the next (inevitable)
super-storm; here's an excerpt: "...
The predictable chaos and lack
of information are the outcome of any disaster, but one year after Sandy
(which killed 150 people and damaged or destroyed some 650,000 houses),
officials, charities, and disaster experts are concluding that much can
be done to smooth the recovery process—and that there’s more for
architects to do other than drive-by damage assessments and holding
empty “ideas” competitions. Now architects are working in neighborhoods
to link people like Chati to the resources they need. Sandy was a much
more destructive storm than predicted, and so-called 100-year storms may
now arrive much more frequently. Such unprecedented climate violence
makes the option of simply rebuilding questionable..."
Photo credit above: Sage and Coombe Architects. "
Sage and Coombe Architects’ trellised canopies perch in front of restored concession stands in Queens, N.Y."
Ted Fujita Defined Getting Blown Away.
The meteorologist and legendary tornado researcher who's name became
the basis for the F-scale for rating the destructiveness of tornadoes is
featured in this excellent article at
The Tennessean; here's a clip: "...
The
Weather Bureau was formed in 1870 to take meteorological observations
and to give notice of the approach of severe storms to the coastal areas
of the United States and the Great Lakes. The service started as a part
of the U.S. Army Signal Corps, moved to the Department of Agriculture
in 1890, and then to the Department of Commerce in 1940; in 1970, it was
renamed the National Weather Service and became part of the renamed
National Oceanic and Atmospheric Administration. The service is
dedicated to improving the safety of Americans and their property.
However, it was not until 1950 that forecasters were freed to use the
word tornado in their forecasts and warnings. Prior to a July 12, 1950,
authorization, which stated, “There is no regulation or order against
the forecasting of tornadoes,” the bureau was actively discouraged and
often prohibited from predicting tornadoes for fear of striking
unreasonable panic in the public..."
Photo credit above: "
Theodore Fujita was born Fujita Tetsuya." University of Chicago.
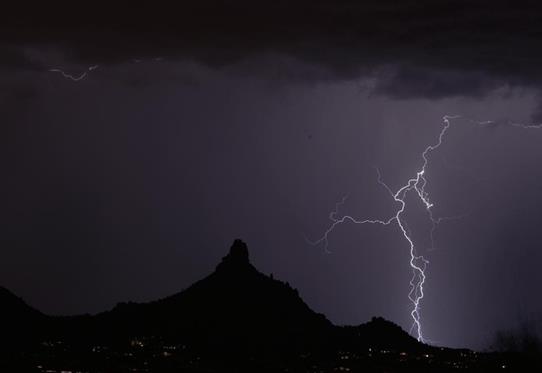
Cool Discovery: Mountains Moved By Lightning. I had no idea. Here's a clip from a story at
reasons.org: "
Lightning, as fleeting as it may be, shapes the land around us.
Although many processes weather the landscape, a recent paper published
in the journal Geomorphology demonstrates that rock formations of a
particular shape and signature were thought to result dominantly from
cold temperatures. However, studies of such rock formations in Lesotho, South Africa show that lightning strikes also play a major role..."
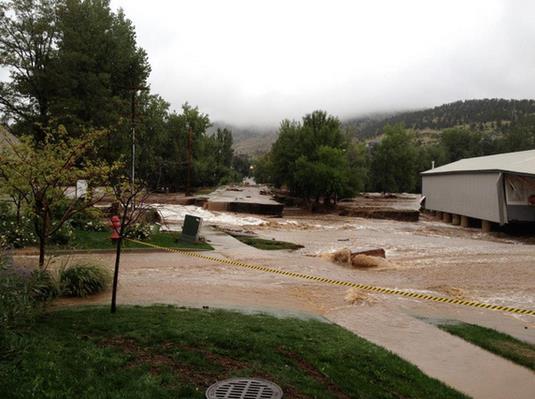
Too Close To Home: Deluge Engulfs Flood Researcher's Town. LiveScience has the article; here's the intro: "
G.
Robert Brakenridge has spent his career researching floods. But a
lifetime's worth of knowledge didn't make it any easier when his own
life was upended by rushing water. Brakenridge, the director of the
Dartmouth Flood Observatory and a senior scientist at the University of
Colorado, Boulder, was among the hundreds of people cut off from the
world in Lyons, Colo., in September, when days of heavy rain, unleashed
torrential floods along the Colorado foothills..." (Photo credit above:C. R. Brakenridge).
The 27 Most Glorious Moments In The History Of BBC Weather.
I'm getting dizzy - hope this guy is wearing tennis shoes, because he's
getting a work-out. Here is a fascinating (R-rated) chronology of how
weather has been communicated in the UK since 1936, courtesy of those
wonderful troublemakers over at
BuzzFeed: "
BBC Weather is eternal. It’s been there 27 minutes and 57 past the hour since 3645 BC, hasn’t it?"
I Don't Need No Stinking TV Weather Graphics!
This confirms my theory. We went from telling weather stories around a
campfire to telegraph, telephone, magic markers, magnetic boards, crude
blocky 2-D graphics to 3-D fly-through (rings a bell) to interactive
touch-screen maps and tablets. What's next? Depending on the economy and
Q4 advertising sales, your favorite local TV station may have to resort
to WeatherBoard HD. I think it has serious potential. Check out this
clip on
YouTube: "
WEATHER
BOARD HD! Wednesday morning, Jonathan Oh's weather computer decided to
go on vacation, so it was time to introduce the newest item in the
arsenal of our weather center... the "Weather Board HD"! It's
interactive, live, and easy to read!"
Move Over Bezos, ESPN Can Do News Better Than You.
I doubt ESPN will dilute its (incredible) sports brand by moving into
news, but the velocity at which media is transforming today? Nothing
would surprise me. Here's a clip from an interesting story at
Reuters: "...
Like
Alexander the Great, ESPN has recorded so many victories in such a
brief time that it will soon weep upon discovering that no additional
sports worlds exist to conquer. The company has entered its mop-up
phase, a place where most mature companies end up, doing more of what it
does best, finding new ways to serve the old stuff, but not advancing
at the old velocity. But if ESPN wanted to break out of the gold-plated
sports ghetto that it now owns, what better strategy than to spend its
millions refashioning itself as “The Worldwide Leader in News.”
International news. Political news. Domestic news. Cultural news.
Business and financial news. Local news (it already has a sports
presence in five top cities). Weather. And, yeah, even sports. The idea isn’t as fanciful as it seems..."
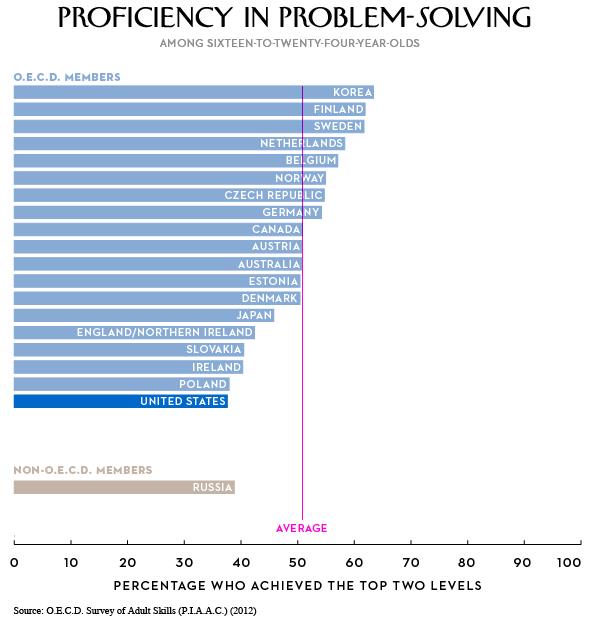
Measuring America's Decline, In Three Charts.
I firmly believe our best days are ahead of us. We'll have plenty of
challenges, and education and literacy, especially science literacy, are
near the top of the list. Here's a clip from a sobering story at
The New Yorker: "...
But
the data comparing young adults aged sixteen to twenty-four in
different countries—the folks who will be manning the global economy for
the next thirty or forty years—deserves a closer look. The figures come
from three charts in the report’s statistical annex,
which we have adapted here. Taken together, they vividly illustrate
some of the challenges facing an economic hegemon that has for decades
been plagued by wage stagnation and rising inequality, and which, as
President Obama has pointed out, desperately needs to raise its game..."
The Starbucks Guide To World Domination?
How did they go from one store in Seattle to one store on every block
in the USA? Well, it sure seems that way. Here's an excerpt of a
fascinating read at
Slate: ..."
So how did Schultz take Starbucks from a small chain—six stores as of 1984—to world domination: 18,000 stores in 60 countries,
generating $13 billion in sales? First, he quit. If he couldn’t sell
drinks to Starbucks customers, he would start his own chain. In 1986,
Schultz, backed by Seattle investors, started a company called Il
Giornale, opening three stores in less than a year. And so why is it
that today we all drink Starbucks and not Il Giornale? It’s not because
Schultz failed. It’s because Baldwin and Bowker decided to sell
Starbucks to focus their energy on Peet’s Coffee, which Starbucks had
purchased in 1984..."
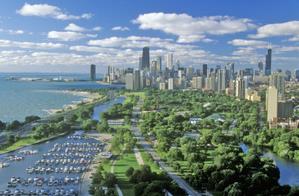
Chicago Makes It Easier To Put Solar Panels On Roofs.
Grist has the article - here's the intro: "
The
Windy City is blowing red tape and roadblocks out of the way for new
solar-panel owners. It used to take a month to receive a city permit
needed to install a small solar array. That’s being reduced to one day. Meanwhile,
the price of the permit is falling 25 percent to $275. These
improvements are thanks to a grant from the U.S. Department of Energy.
“It will encourage more and more people to have solar here in the city
of Chicago on a residential and commercial level,” Mayor Rahm Emanuel said as he announced the changes at a solar event. “It will be cheaper, quicker and more efficient for people to put solar in...”
Photo credit above:
Shutterstock "
More solar is on its way."
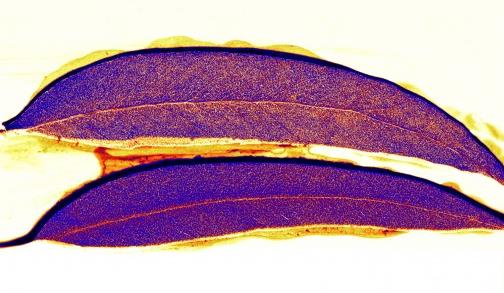
Golf Leaf Trees Discovered In The Australian Outback. Now I've officially seen everything, after reading this amazing article at
Gizmag; here's the introduction: "
Scientists
from Australia's Commonwealth Scientific and Industrial Research
Organisation (CSIRO) have discovered that eucalyptus trees in the
Australian outback are drawing up gold particles from deep underground
through their root system and depositing the precious metal in their
leaves and branches. Rather than being a new source of "gold leaf," the
discovery could provide a cheaper, more environmentally friendly way to
uncover valuable gold ore deposits..."
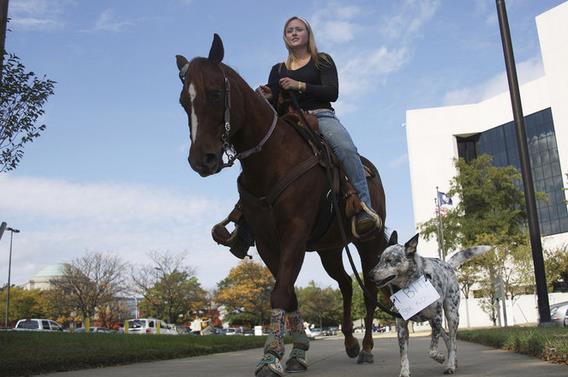
Ride A Horse, Save A Camry. Well, here's one way to get to the local DMV.
The Atlantic has the story; here's the intro: "
Sometimes
the most efficient transportation technology is a very, very
traditional transportation technology. Sometimes, if you've got
somewhere you need to be, all the horsepower you need comes from a single horse. Take Ashlee Owens. The Virginia 26-year-old recently had her license suspended by the Virginia DMV after the agency hadn't received proper proof-of-insurance paperwork. (She'd made "numerous attempts" to send the documents, the AP reports, but the DMV had apparently not received them. Phone calls in which she attempted to lift the suspension were, it seems, similarly unsuccessful.)..."
Photo credit above: "
Owens, cruising the streets of Richmond." (Associated Press).
The Lost Wheels "Rule for a Day" Record Release Show.
Looking for something to do Saturday night? Check out the Lost Wheels,
an up and coming local rock/blues band releasing a new CD (and vinyl)
this weekend. "The Lost Wheels fuse together old-school American blues
with up-tempo Australian pub rock – combining a hint of funk and a heavy
dose of slide guitar." More info:
http://thelostwheels.com/bio/
Website:
http://thelostwheels.com/ Facebook :
https://www.facebook.com/thelostwheels
42 F. high in St. Cloud Thursday.
53 F. average high on October 24.
58 F. high on October 24, 2012.
1887: Albert Lea set a record low of -6 degrees F.
1830: Heat wave at Ft. Snelling. Temperature reached 80. Data courtesy of the Twin Cities National Weather Service.
TODAY: More sun, feeling better. Winds: SW 15-25. High: 51
FRIDAY NIGHT: Partly cloudy Low: 35
SATURDAY: Some sun, windy & cooler. High: 44
SUNDAY: Fading sun, a bit milder again. Wake-up: 26. High: 47
MONDAY: Partly sunny, heavier jackets. Wake-up: 29. High: 37
TUESDAY: Light mix over southern Minnesota. Wake-up: 27. High: 35
WEDNESDAY: Intervals of sun, brisk. Wake-up: 25. High: 42
HALLOWEEN: Cold rain for Halloween? Rain may change to wet snow. Wake-up: 32. High: 40
Climate Stories...
"Australia's
Bureau of Meteorology says this year the average daily temperature has
been 1.36 degrees above the historical average and the 12 months ending
September 30 were Australia's hottest year ever recorded". -
The Sydney Morning Herald.
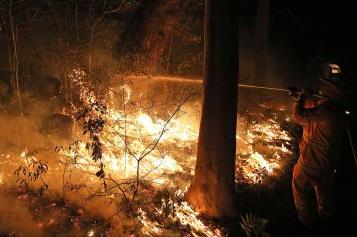
Climate Change Affects Australia's Epic Wildfires - No Matter What Prime Minister Says. Here's a clip from
Time Magazine: "
Wildfires are nothing new in Australia, a sunburned country with
plenty of vegetation to burn to a crisp when temperatures skyrocket
during the southern-hemisphere summer. Deadly wildfires are immortalized
in Australian history, including Black Saturday in 2009, when a
frighteningly fast wildfire
in southern Australia killed 173 people in a single day. The blazes
that burned in southeastern Australia this past week may not go down in
history — just one death
has so far been reported, which is a testament to the bravery of the
country’s firefighters and the experience that most Australians have in
dealing with fires. But the wildfires did manage to burn more than
121,000 hectares, and the smoke blackened the skies of Sydney,
Australia’s largest city, while damage is set to exceed $100 million..."
Photo credit above: Rob Griffith - AP. "
Firefighters control flames during hazard reduction in Bilpin, 46 miles from Sydney, Oct. 23, 2013."
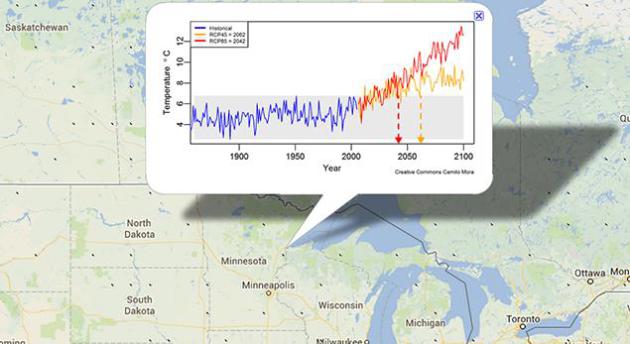
A New Look At Climate "Tipping Points", Where Familiar Patterns Vanish Forever.
The concept of "average weather" continues to morph as the climate
system continues to warm over time. What does a "tipping point" look
like for Minnesota and the Midwest? One significant milestone
highlighted in this article explains that it's the point at which the
coldest years to come are warmer than the hottest years already
experienced by anyone now alive. Ron Meador at
MinnPost
takes a look a potential local tipping points and the implications.
Expect a slow warming trend to continue, along with increasingly
frequent episodes of head-snappingly-strange weather. Here's an excerpt:
"
Every so often, though, a piece of research comes along to show
with special clarity and power the fix we're in, how rapidly we are
hurtling toward a world entirely outside our experience of this
one. Such a study appeared earlier this month in Nature, a journal whose
prestige may assure that the authors' new term "climate departure"
becomes as commonplace as climate change, climate disruption and climate
chaos. "Climate departure" refers to a kind of tipping point at which
the up-and-down fluctuations of annual temperature averages climb into a
zone completely and permanently outside a "normal" range established in
a record going back to 1860..."
Graphic credit above:
CC/Camilo Mora "
This
detail from the researchers' interactive map suggests that within three
to four decades, the Twin Cities region will be permanently outside its
historical temperature range — that is, the region's coldest years will
be warmer than the hottest years in a record stretching back to 1860.
The red line is for temperatures modeled on a business-as-usual
scenario, in which greenhouse gas emissions continue to rise without
major new efforts to curb them; the yellow line is for temperatures
modeled on a scenario of aggressive global reductions."
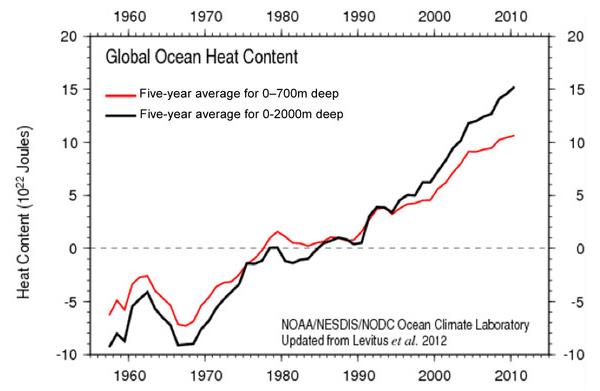
Mystery Of The "Missing" Global Warming.
Here is a good summary of a major point climate scientists are making:
over 90% of the observed warming is going into the world's oceans. Here
are two clips from a recent story at
Bloomberg Businessweek: "...
Have
you heard the one about how global warming stopped in 1998? It’s been
called a “pause,” a “hiatus,” a “slowdown” and a “siesta.” Above all,
it’s a red herring, and it isn’t difficult to find where some of the
‘missing’ heat has gone....The warming at the ocean’s surface layer may
have slowed a bit, but ocean temperatures in aggregate have continued to
rise unchecked during the so-called hiatus, according to the IPCC.
That’s important because while the atmosphere accounts for just 1
percent of planetary heat, the oceans carry 93% of the stored energy
from climate change (melting ice and warming continents make up the
rest)...."
Graph credit: National Oceanographic Data Center (NODC).
Canadian Arctic Warmer Now Than Last 44,000 Years? Here's an excerpt from a News Consortium story at
Catholic Online: "
A
new study reveals that temperatures across the Canadian Arctic are now
greater than they have been in the last 44,000 years, and possibly
longer. Scientists say it is more proof of anthropogenic global warming.
A new study shows that Arctic temperatures are the highest they have
been in the past 44,000 years and possibly even the hottest in the past
120,000 years. Gifford Miller, a researcher from the University of
Colorado, Boulder, wrote a letter in coordination with the journal
Geophysical Researchers Letters that was published online this week. The
letter says that the study proves the warming we're witnessing in the
Arctic is unprecedented in modern times and real..."
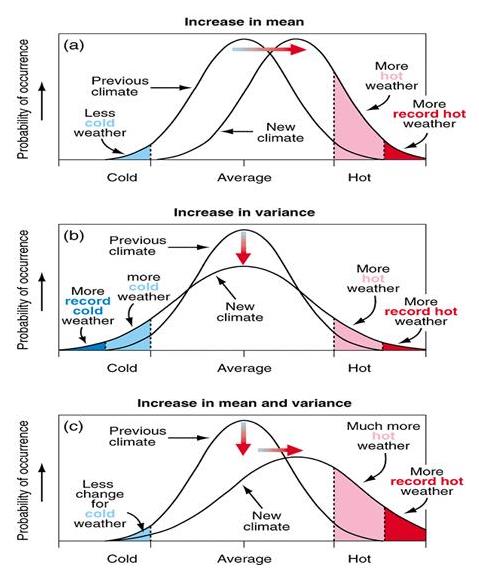
Disequilibrium Is Not Your Friend.
Global warming is a totally inadequate phrase for summing up what we're
seeing in the data and around the world. Climate volatility better
explains the changes. Global weirding, climate instability or even
disequilibrium might be a better phrase, as described by Michael Tobis
at
Planet 3.0; here are a couple of clips:"...
That
is to say, it seems to me that the usual method of attribution
acknowledges global warming (the graph shifting to the right, in figure
(a)) but not global weirding ((b)). So, is this really what is
happening? Just a few days ago I thought it was too early to tell, but I was wrong. Hansen, Sato and Reudy have a paper submitted to PNAS and published on Hansen’s website.....And
this is why “global warming” is an inadequate name for what is
happening. Climate is changing very quickly. Some of the slower parts of
the system are just starting to wake up. We are entering a period of
increasing disequilibrium, and what we are seeing is unequivocally worse than we expected."
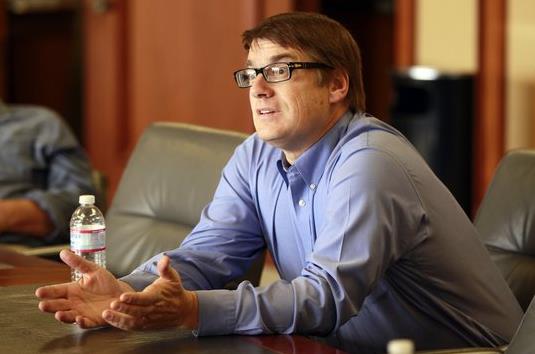
Hot Topic: The Science Of Global Warming And The Public Disconnect.
U-T San Diego
has the first part of a 3-part series on why it's easier to deny or
dismiss a growing scientific body of evidence than take steps to
mitigate the risk; here's an excerpt:
Q: Could you summarize the findings in the latest IPCC report?
SEVERINGHAUS:
They said five years ago that they were 90 percent sure that more than
half the warming was human-caused in the past 50 years. Now they’re 95
percent sure. This is basic physics. There is natural climate change. We
know that. And so if you’re going to make a statement like more than
half of the warming over some particular time is due to humans, you also
have to know how much was natural. And it’s just really hard to know
how much is natural. And that’s why that figure is 95 percent and not 99
percent, or 99.99 percent...
Photo credit: "
Jeff Severinghaus, a professor of geosciences at Scripps Institution of Oceanography."
— K.C. Alfred.
A Fine Vermont Wine? Yes, a slow-motion warming is benefiting grape growers and wine producers...in Vermont?
CBS News has the story; here's an excerpt: "
While
no one wants to promote climate change, a group of Vermont winemakers
can thank the state's rising temperatures for an economic boost. They
have been able to add warmer-weather varieties, like pinot noir, to
their selection. Thirty years ago, winemaker Patrick Barrelet says, the
grapes would not have survived Vermont's cold winters. "We definitely
have seen bigger crops in I'd say the last 10 years," he told CBS News,
adding that he thinks it is because of climate change. "They're very
cold sensitive and if you don't have a warmer winter, you don't have a
crop," he continued..."
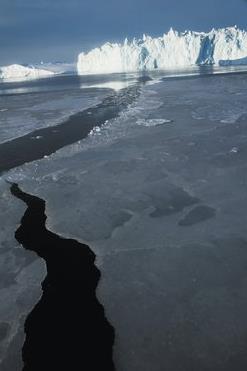
Gambling With Civilization. Here's an excerpt of a book review at
The New York Review of Books: "...
So
the future is uncertain, a reality acknowledged in the title of
Nordhaus’s new book, The Climate Casino: Risk, Uncertainty, and
Economics for a Warming World. Yet decisions must be made taking the
future—and sometimes the very long-term future—into account. This is
true when it comes to exhaustible resources, where every barrel of oil
we burn today is a barrel that won’t be available for future
generations. It is all the more true for global warming, where every ton
of carbon dioxide we emit today will remain in the atmosphere, changing
the world’s climate, for generations to come. And as Nordhaus
emphasizes, although perhaps not as strongly as some would like, when it
comes to climate change uncertainty strengthens, not weakens, the case
for action now. Yet while uncertainty cannot be banished from the issue
of global warming, one can and should make the best predictions
possible. Following his work on energy futures, Nordhaus became a
pioneer in the development of “integrated assessment models” (IAMs),
which try to pull together what we know about two systems—the economy
and the climate—map out their interactions, and let us do cost-benefit
analysis of alternative policies..."
Photo credit above: Stanley Greene/NOOR/Redux. "
Greenland, photographed from a boat navigating the melt where dog sleds used to travel across the ice, October 2009."
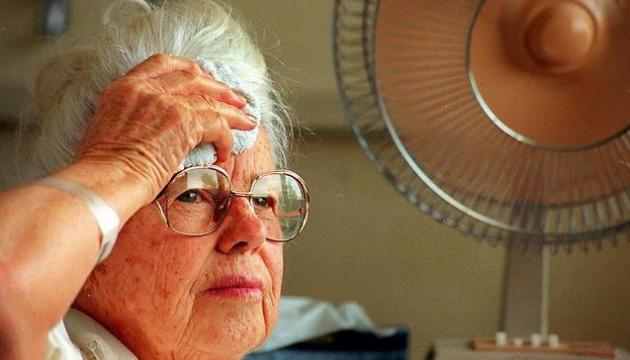
Killer Climate Change: Deaths On The Rise. Data for Stockholm, Sweden was analyzed, and warmer weather is resulting in more heat-related mortality.
The Guardian has the story; here's a clip: "
Scientists
say that because of the increasing temperatures associated with climate
change, deaths from heat exposure appear to be on the rise. The
problem, they say, is that when temperatures go up, it causes longer,
more frequent and hotter heat waves. Even without the effects of global
warming, heat waves tend to be killers, with hundreds of American dying
each year . And, with it, they tend to be much worse..."
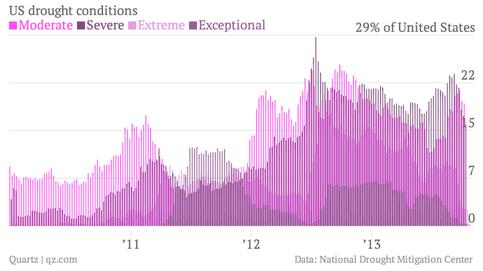
Climate Change Cost You The McDonald's Dollar Menu.
Quartz has the story - here's the intro: "
The
McDonald’s “Dollar Menu” is no more—or rather, it will now be the
“Dollar Menu & More,” including sandwiches, sides, and snacks that
cost up to $2. The new menu, driven by rising prices on commodities, is
the product of extensive negotiations between McDonald’s corporate
headquarters and their franchisees. Here are some of the trends behind the change.
1). Droughts have driven up the wholesale price of cattle
. Since 2011, rising temperatures across the United States have led to drought conditions in cattle-ranching states like Texas and Oklahoma.


No comments:
Post a Comment