66 F. high in St. Cloud Tuesday. That's the average high for early May.
46 F. average high on March 29.
52 F. high on March 29, 2015.
March 30, 1938: Springtime flooding hits Warroad and Grand Marais.
April Showers Come Early This YearYes,
it's a little early to plant your annuals. The old rule of thumb was
"wait until after Mother's Day to be safe from frost". Now? Good
question. As winters shrink and the growing season expands there will be
a temptation for farmers to sneak in an early planting. A longer
frost-free season sounds good on paper, but it may be accompanied by
more pests, allergens and invasive species.
There's always a catch.
At
least we're not grappling with spring flooding this year, one benefit
of a Peoria Winter. A temperature relapse is likely; nothing shocking or
headline-grabbing, but temperatures run 5-10F below average
Friday into
Monday, with daytime highs near 40.
My
hosta plants are poking little fingers of green through the topsoil,
some 2-3 weeks ahead of schedule. Yesterday I had my first powerboat
sighting on the lake. Boating in Minnesota - in March?
Wow.
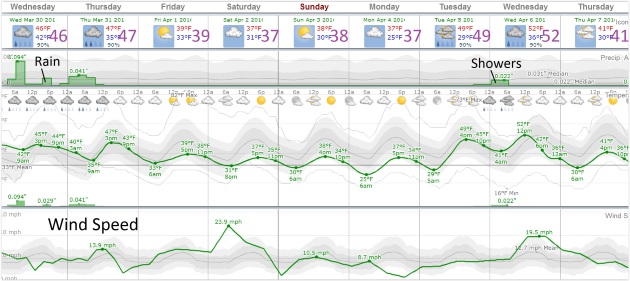
Showery rains are likely today and
Thursday;
jackets stage a comeback by late week with a few frosty nights
expected. 50s return late next week; GFS models even hinting at 60F.
No rude April Fools jokes brewing just yet.
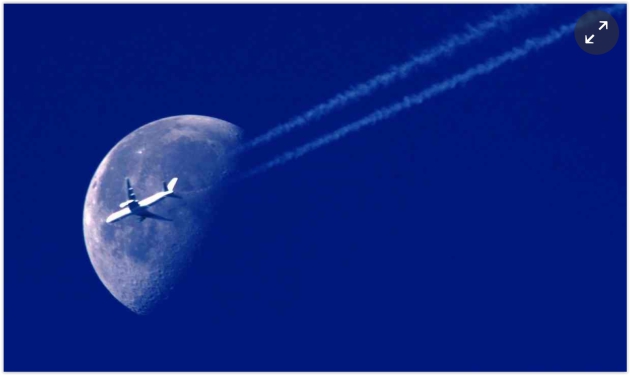
Image credit:
Mike Hall Photography.
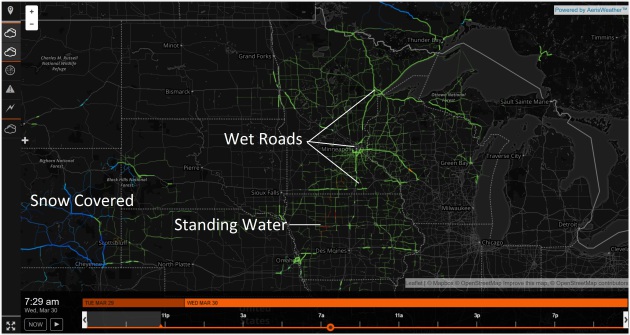
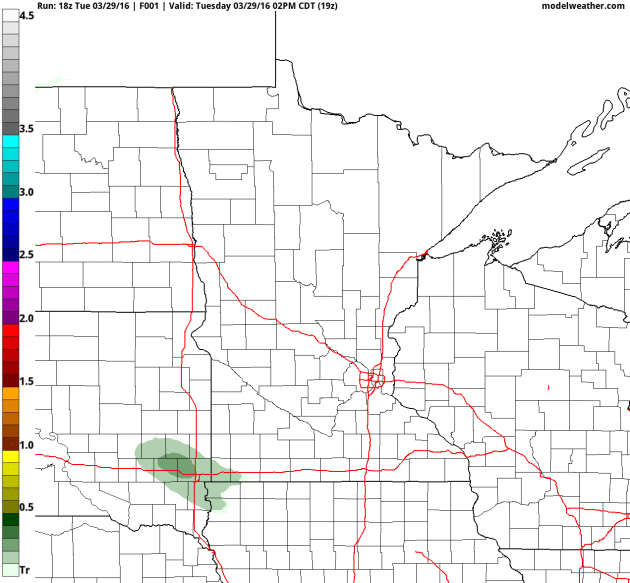
Soggy AM Commute.
Our internal models show (very) wet roads across most of Minnesota and
western Wisconsin this morning at 7:30 AM. Heavier rains may result in
standing water and flash flooding over central Iowa - farther west
surface temperatures cold enough for snow covered roads in Wyoming.
Source: Aeris Enterprise.
Southern Surge.
12 KM NAM model guidance from NOAA forecasts the heaviest rains from
the MSP metro into Iowa; numerous .5 to 1"+ amounts; as much as 2" near
Waterloo and the Quad Cities. 84-hour rainfall amounts: AerisWeather.
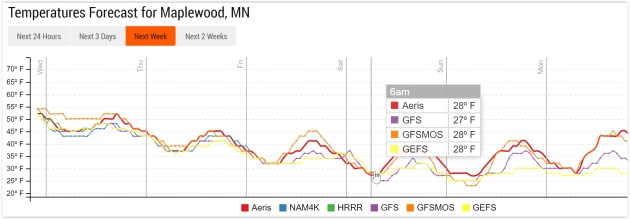
Cooling Trend.
I think European guidance is a few degrees too cool later this week;
highs will be near 40F by the weekend with lows dipping below 32F. A
warming trend returns early next week with a shot at 50F by Tuesday.
Source: WeatherSpark.
Coldest Morning: Saturday.
Much of the metro area will wake up to upper 20s Saturday morning.
Wait, it's Minnesota - frost in early April is quite normal.
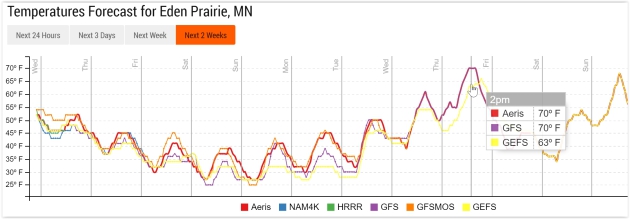
Warming Trend Next Week.
GFS numbers bring 50s and 60s back into the Twin Cities late next week;
an outside chance of 70F a week from Thursday. Big swings - pretty
typical for early April.
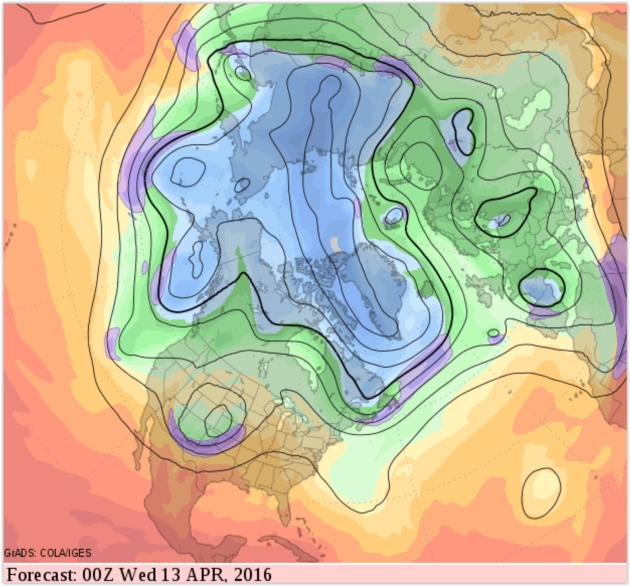
Mild and Wet.
Peering 2 weeks over the horizon extended models forecast a milder than
average pattern; a cut-off low pressure system approaching from Denver
with another push of rain and T-storms. The maps look more like late
April. Source: GrADS:COLA/IGES.
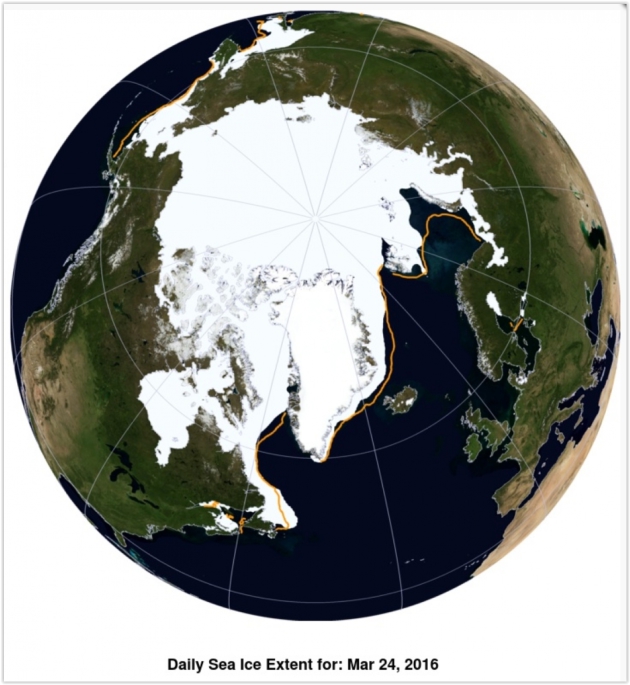
Arctic Sea Ice Hits Record Low Peak, Again.
Climate Central has an update on historic warmth at the top of the world and the impact on sea ice; here's a clip: "...
The
Arctic is in crisis. Year by year, it’s slipping into a new state, and
it’s hard to see how that won’t have an effect on weather throughout the
Northern Hemisphere,” Ted Scambos, an NSIDC lead scientist, said in a
statement. The NSIDC announced on Monday that Arctic sea ice hit its maximum extent for the winter on March 24, when it averaged 5.607 million square miles. That beat last year’s record low
of 5.612 million square miles, set on Feb. 25, 2015, by 5,000 square
miles or just a bit smaller than the area of Connecticut. Last year’s
peak came earlier than is typical, while this year’s was later than the
average peak time. That late peak date sets up a shorter-than-normal ice
melt season this year..."
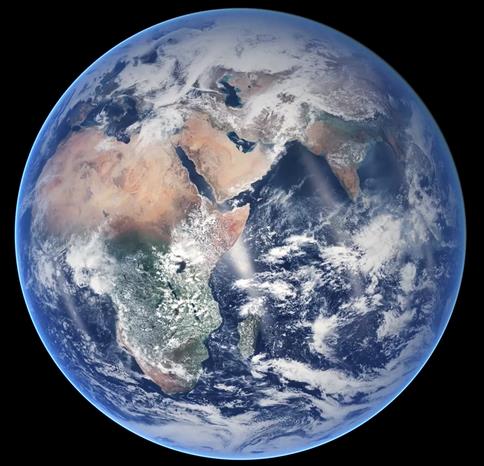
Graphic credit above: "
This NASA Blue Marble image shows Arctic sea ice extent on March 24, 2016." Credit: National Snow and Ice Data Center/NASA Earth Observatory
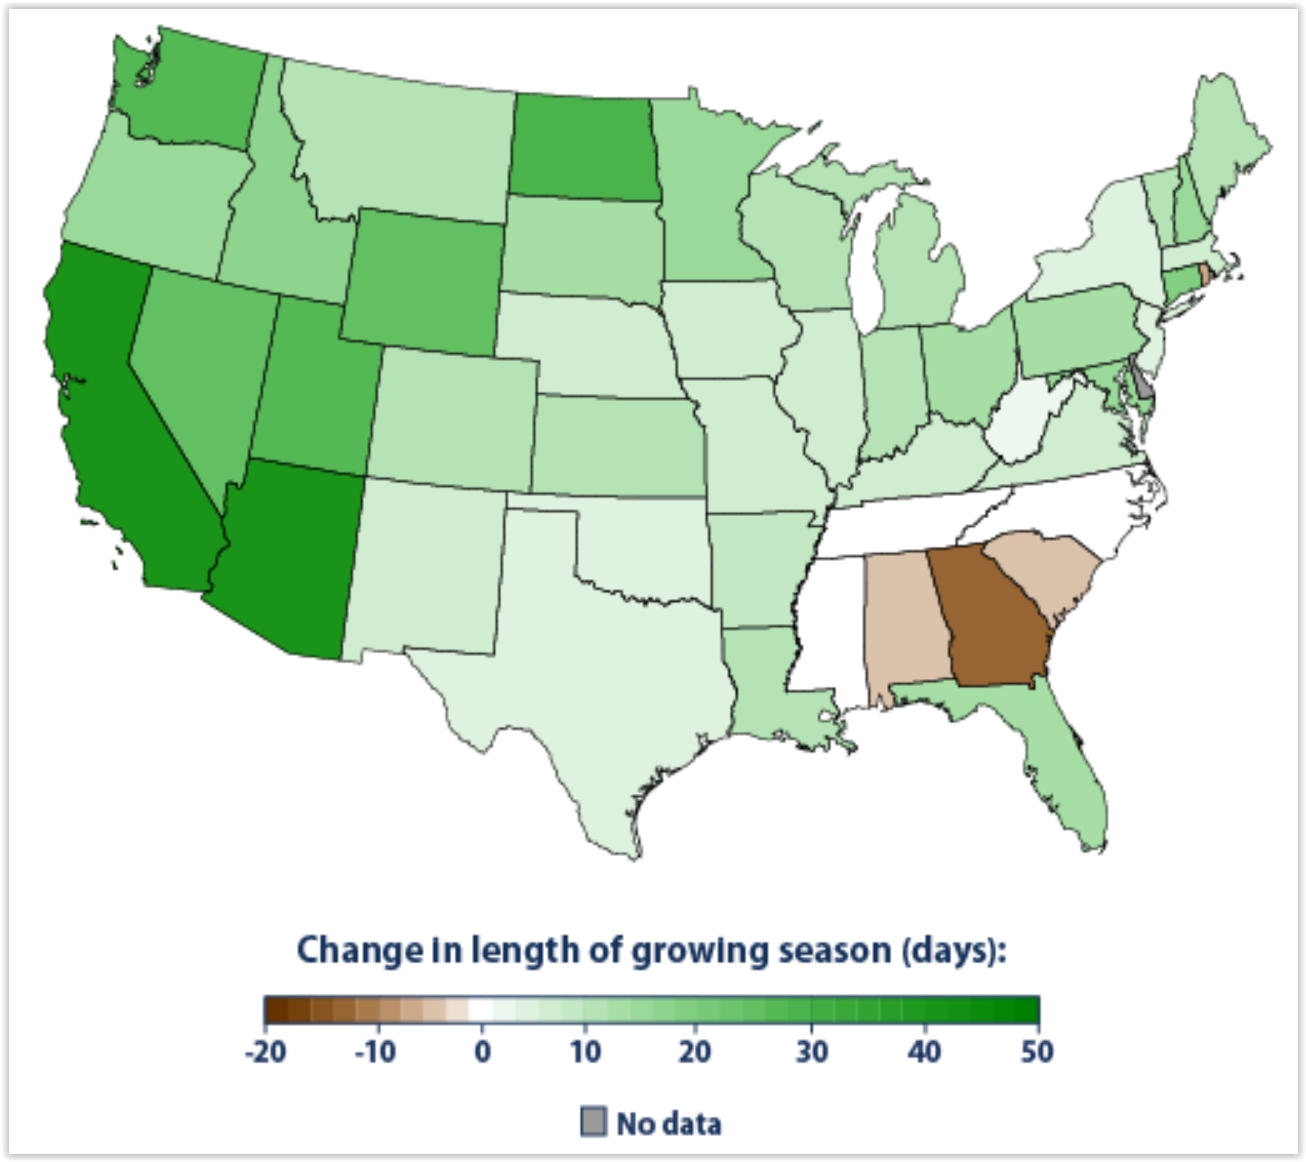 History of Climate Change, As Seen in Frost Maps From 1916. Here's an excerpt from Slate: "...On a website charting indicators of climate change, the Environmental Protection Agency offers a few graphs showing how the growing season in the continental United States has lengthened between 1895 and 2015,
with most of the upswing taking place in the past 30 years. While
stipulating that a lengthening growing season could have positive
effects on yield for some farmers, the EPA notes that "overall, warming
is expected to have negative effects on yields of major crops." A long
season "could limit the types of crops grown, encourage invasive species
or weed growth, or increase demand for irrigation
History of Climate Change, As Seen in Frost Maps From 1916. Here's an excerpt from Slate: "...On a website charting indicators of climate change, the Environmental Protection Agency offers a few graphs showing how the growing season in the continental United States has lengthened between 1895 and 2015,
with most of the upswing taking place in the past 30 years. While
stipulating that a lengthening growing season could have positive
effects on yield for some farmers, the EPA notes that "overall, warming
is expected to have negative effects on yields of major crops." A long
season "could limit the types of crops grown, encourage invasive species
or weed growth, or increase demand for irrigation..."
Map credit:
EPA.
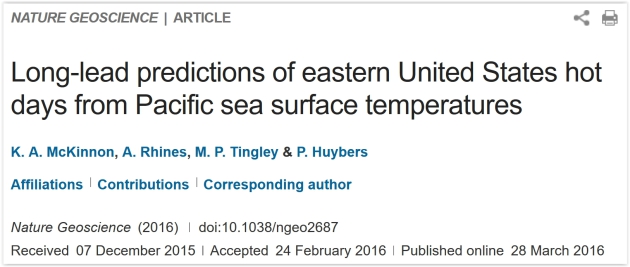
We May Soon Be Able to Predict Heatwaves 7 Weeks Before They Happen.
Don't hold your breath - there may be causal connections, but that
doesn't mean it's easy or straightforward to implement in a forecasting
environment. That said, here's an excerpt of an interesting post at
Mashable: "....
A new study
published Monday in Nature Geoscience shows that a pattern of sea
surface temperatures in the Pacific Ocean along with rainfall deficits
over land may help signal increased odds for unusual heat for the
Midwest and eastern U.S. in particular. The study identified a
pattern of sea surface temperatures in the North Pacific Ocean that
researchers found to be predictive of extreme heat events up to seven
weeks later in parts of North America. The
pattern is best described as an area of the ocean where there is a
sharp contrast between milder-than-average and cooler-than-average
waters..."
New Cousin of El Nino May Forecast Summer Heat Waves Weeks in Advance. Here's more perspective on the study referenced above at The PBS NewsHour: "El
Niño, or the El Niño–Southern Oscillation, is an occasional warming
event in the Pacific Ocean that can initiate weather-related havoc
across the U.S. Now, it has a new cousin. By examining 38 years of
weather, atmospheric scientists have identified an ocean temperature
anomaly — the Pacific Extreme Pattern — that can predict droughts on the
East Coast up to two months before they hit. The team plans to build an
alert system based on these findings, which could allow cities to prep
for life-threatening heat waves, while also reducing people’s electric
bills..." (File image: Barry Wilmore, NASA/ISS).
Long-Lead Predictions of Eastern United States Hot Days from Pacific Sea Surface Temperatures. Here's a link and abstract excerpt of the research referenced above at Nature Geoscience: "...Here
we present a clustering analysis of daily maximum summer temperatures
from US weather stations between 1982–2015 and identify a region
spanning most of the eastern US where hot weather events tend to occur
synchronously. We then show that an evolving pattern of sea surface
temperature anomalies, termed the Pacific Extreme Pattern, provides for
skillful prediction of hot weather within this region as much as 50 days
in advance..."
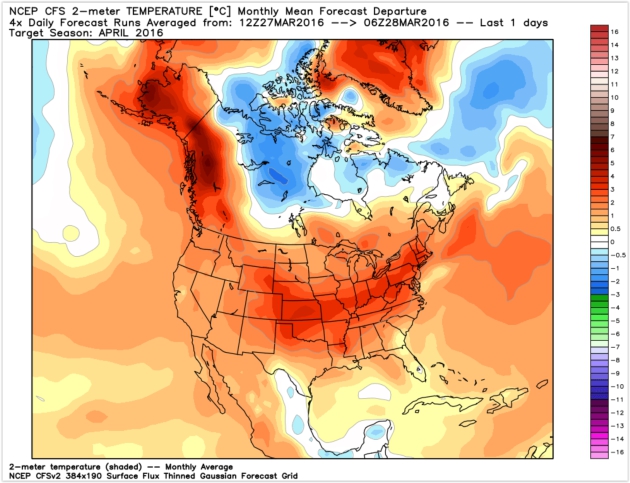
April Preview.
Although not as warm as March (6th warmest in Minnesota history, to
date) April continues the mild trend for most of the USA. NOAA's CFS
(Climate Forecast System) model predicts temperatures 2-4F warmer than
average next month, statewide. Map: WeatherBell.
GOES-R Satellite Could Provide Better Data for Hurricane Prediction.
Resolution will increase substantially from GOES-13; meteorologists are
anxious for the new bird to come online. Here are a couple of excerpts
at
ScienceDaily: "
The
launch of the GOES-R geostationary satellite in October 2016 could
herald a new era for predicting hurricanes, according to Penn State
researchers. The wealth of information from this new satellite, at time
and space scales not previously possible, combined with advanced
statistical hurricane prediction models, could enable more accurate
predictions in the future...GOES-13 provides data at a resolution of 2.5
miles, and GOES-R will increase that to under 0.6 miles for some
frequencies of brightness temperature. The increase in resolution is
especially important because of the size of hurricanes. The eyewall, the
layer of clouds surrounding the eye, varies in size but is roughly 6
miles thick. Using GOES-13 brightness temperatures with 2.5-mile
resolution, the eyewall is often grouped together with other parts of
the storm, with only one or two brightness temperature measurements from
only the eyewall itself. A 0.6 mile resolution brightness temperature
measurement would allow for up to 10 eyewall measurements to be fed into
prediction models as separate chunks of information instead of grouped
together with other parts of the storm..."
GOES-R test loop from February 24, 2016 courtesy of
CIMSS Satellite Blog at the University of Wisconsin.
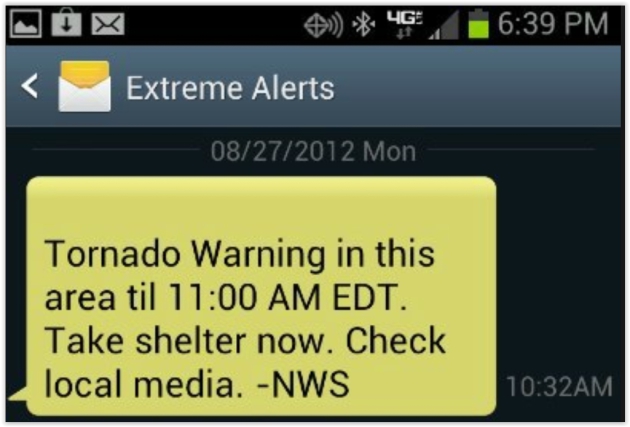
With New Technology, National Weather Service Works to Make Sure Alerts Aren't Ignored.
WBMA has a timely story - here's a link and excerpt: "...
Upgrades
since 2011 to the federal government's Emergency Alert System allow the
National Weather Service to alert every cell phone in a warned area.
The technology allows alerts to be sent directly without relying on
weather radios or television partners to broadcast the urgent
information. "When I'm driving outside of Alabama I don't know what
county I'm in. If there's severe weather in that location that's
affected by that cell tower, I'll get that notification and I'll know
exactly what kind of a threat I'm facing," said De Block. The technology
was the first warning he said for some residents in Pickens County
during a recent severe weather event..."
 Predicting Severe Hailstorms
.
Phys.org
examines new, higher-resolution models (500 meter) trying to isolate
favorable regions for extreme hail; here's an excerpt: "...
Because
of the wide range of spatial and temporal scales that numerical weather
predictions must cover and the fast turnaround required, they are
almost always run on powerful supercomputers. The finer the resolution
of the grid used to simulate the phenomena, the more accurate the
forecast, but the more accurate the forecast, the more computation
required. The highest-resolution National Weather Service's official
forecasts have grid spacing of one point for every 3 kilometers. The
model the Oklahoma team is using in the SHARP project, on the other
hand, uses one grid point for every 500 miles - six times more resolved
in the horizontal directions..."
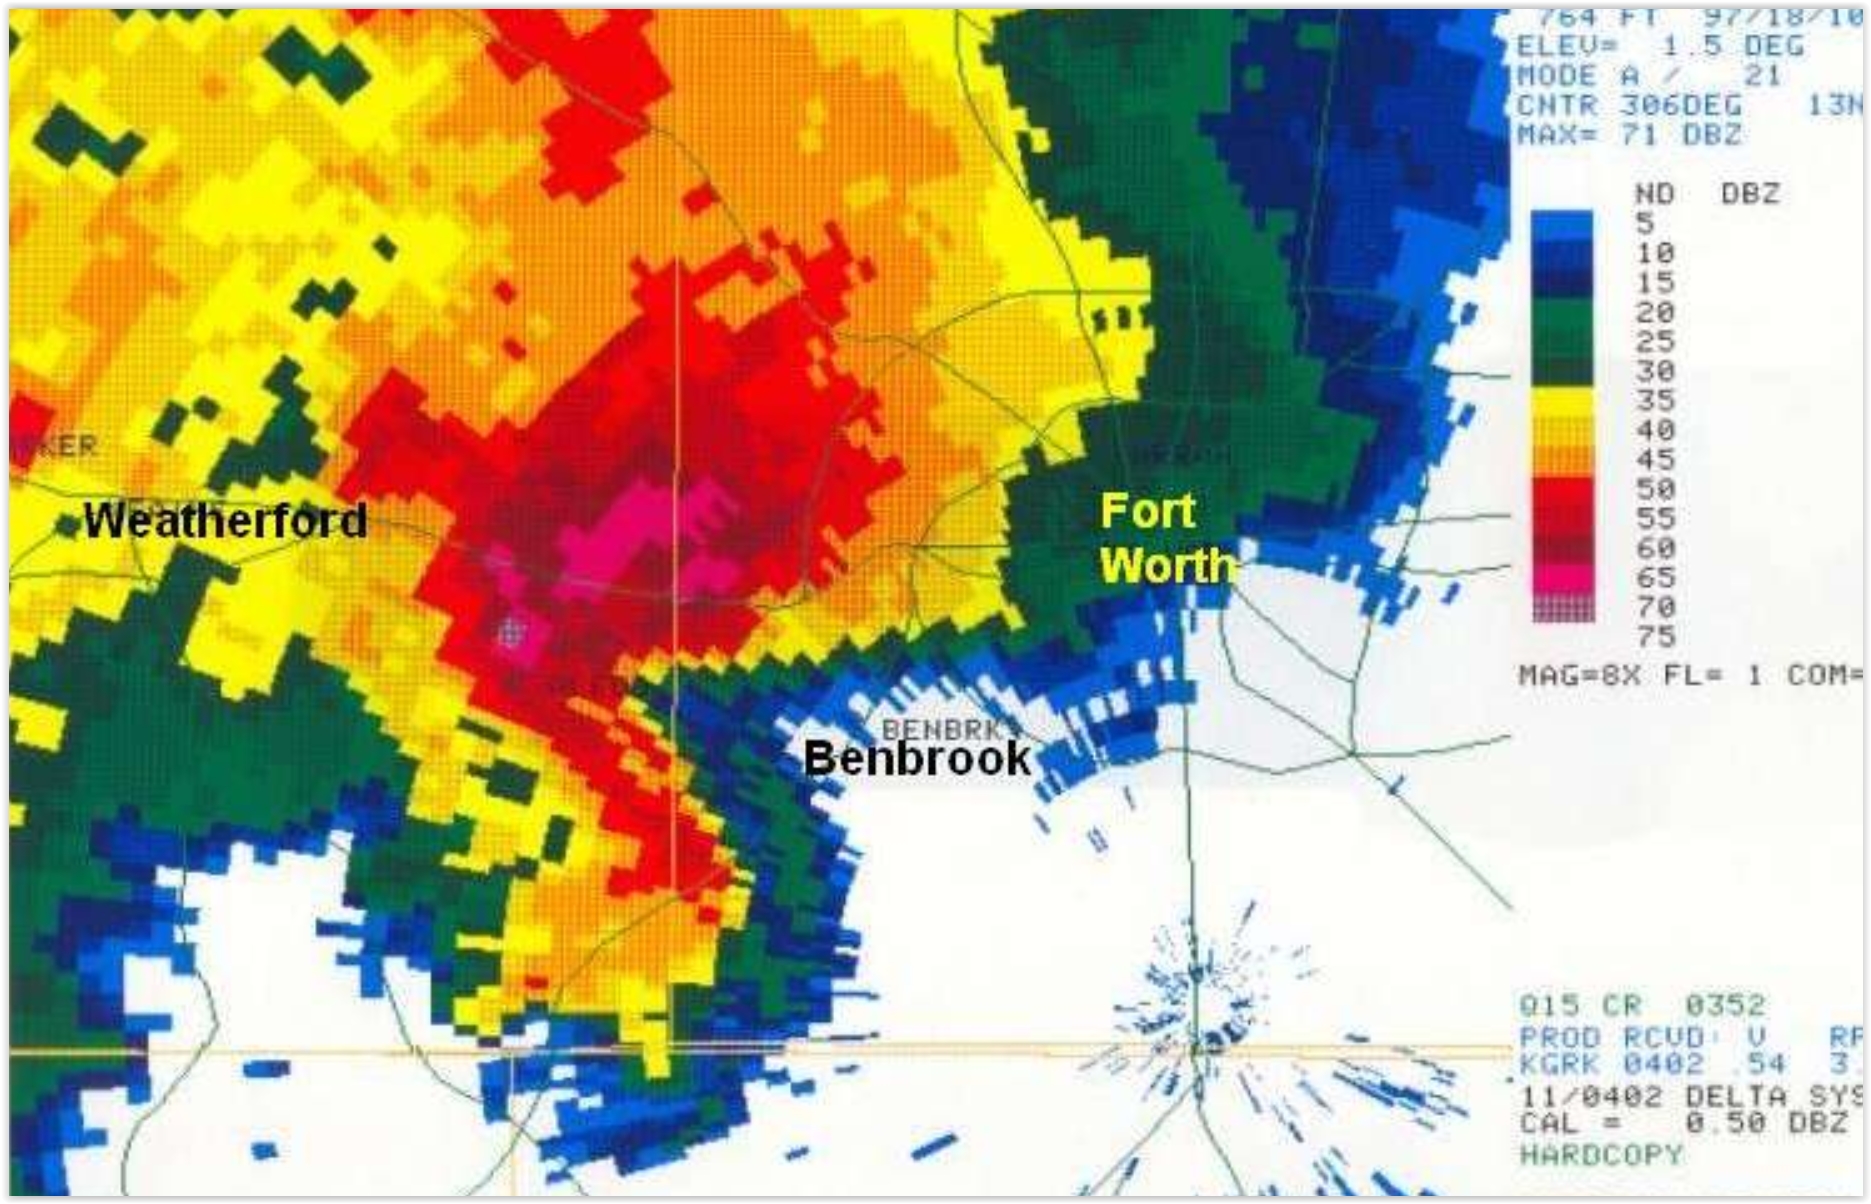
Image credit above: "
Radar
imagery from 6:56 p.m. shows a close-up of the Mayfest supercell
centered west of Benbrook, Texas. The pink and darkest red colors
represent radar indications of large hail with this storm. The storm
impacted the Mayfest festival at 7:10 pm." Credit: National Weather Service.
Because
of the wide range of spatial and temporal scales that numerical weather
predictions must cover and the fast turnaround required, they are
almost always run on powerful supercomputers. The finer the resolution
of the grid used to simulate the phenomena, the more accurate the
forecast; but the more accurate the forecast, the more computation
required.
The highest-resolution National Weather Service's
official forecasts have grid spacing of one point for every three
kilometers. The model the Oklahoma team is using in the SHARP project,
on the other hand, uses one grid point for every 500 meters—six times
more resolved in the horizontal directions.
Read more at:
http://phys.org/news/2016-03-severe-hail-storms.html#jCp
 Largest Wildfire in State History Ravages Kansas
. Here's an excerpt of an update at
ThinkProgress: "...
Still
Republican Gov. Sam Brownback signed a State of Disaster Emergency
declaration for at least five Kansas counties. Brownback said Thursday
that the fire was largely contained in Kansas except in Barber County,
southwest of Wichita, the state’s largest city. “Things really appear to
be going pretty well so far today,” he told the Associated Press. The
Barber County fire is about 31 percent contained, according to
authorities. Meanwhile, smaller fires were reported in Clark, Meade,
Harvey and Reno counties, The Wichita Eagle reported Saturday. Kansas has been suffering from abnormal weather in recent years. And while some recent reports note that Kansas won’t be as affected by climate change as other states, recent temperatures have been unusually warm, making the region suceptible to wildfires..."
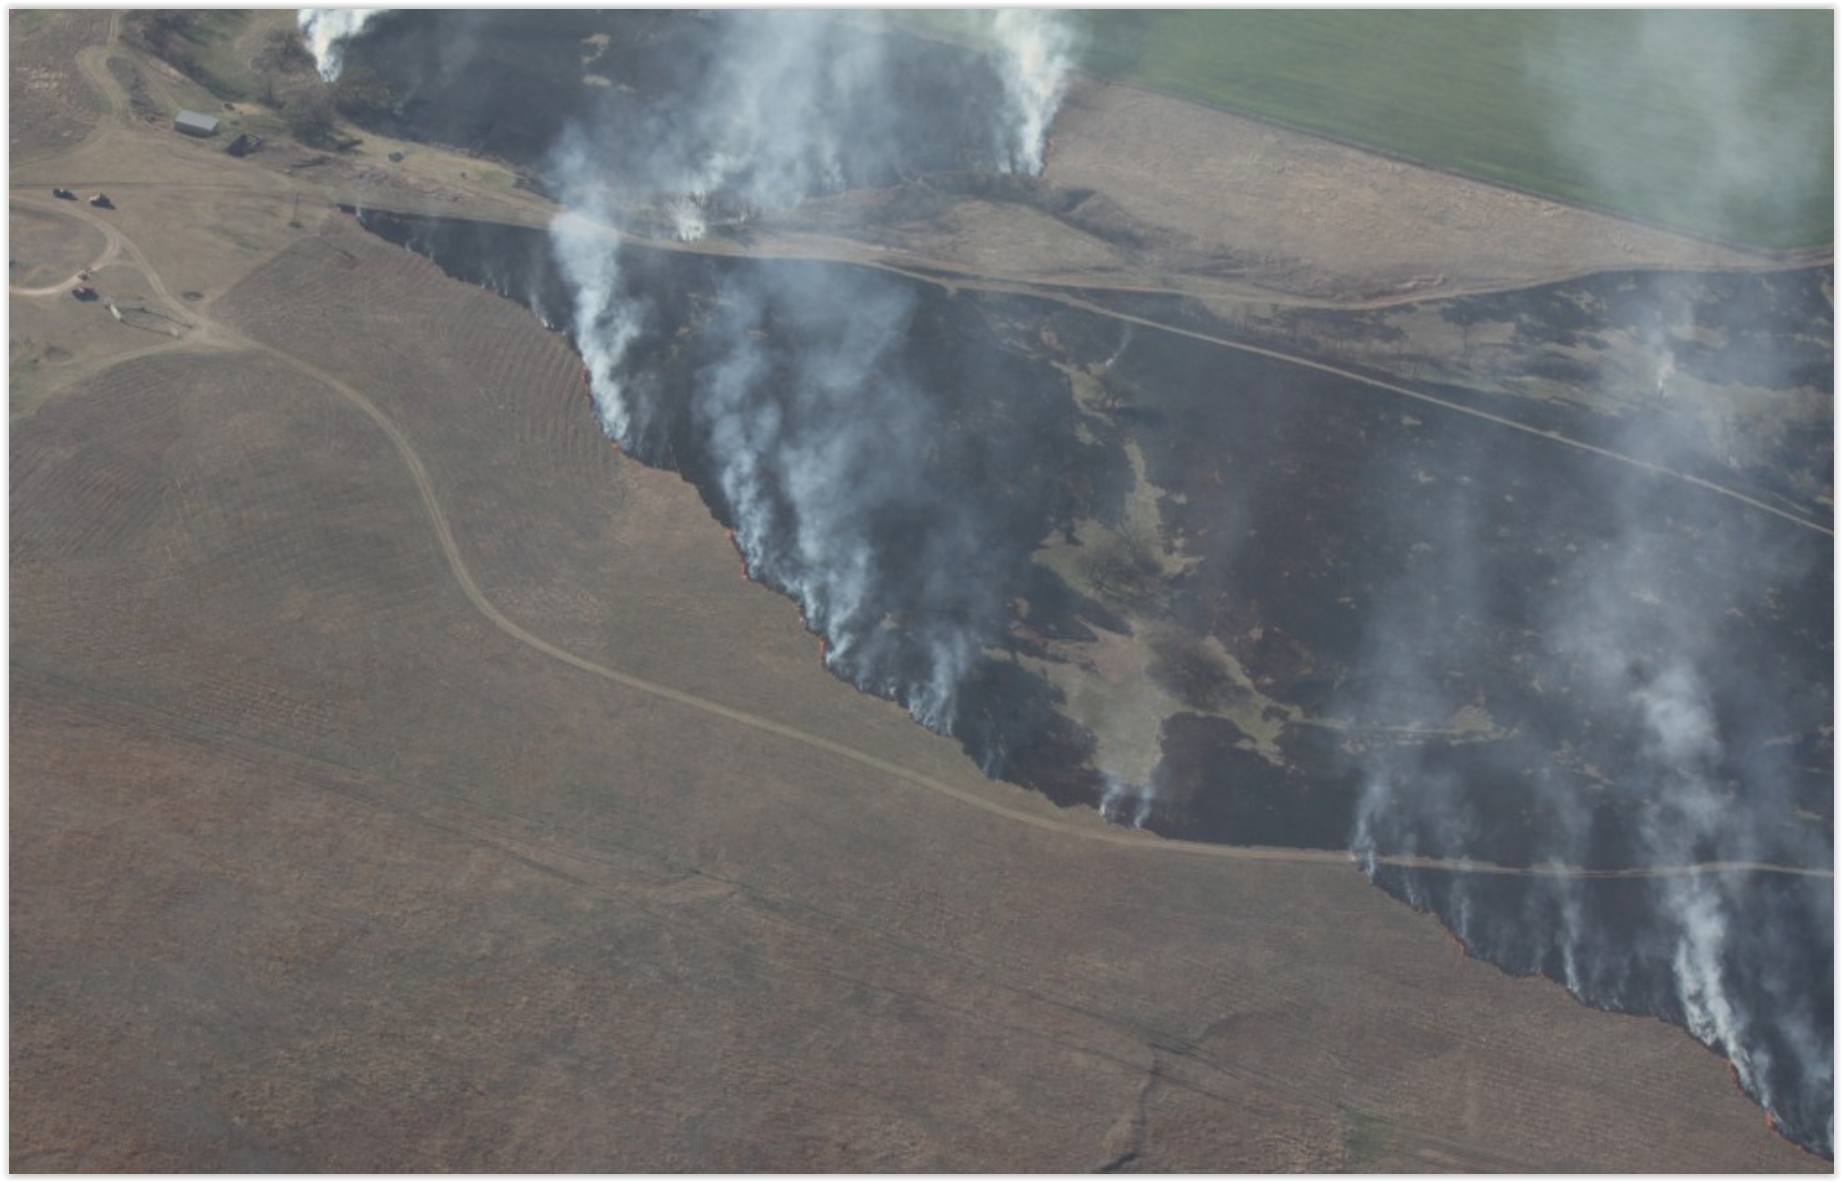
Image credit above: Kansas Forest Service. "Aerial
view of the Kansas wildfire that so far has burned some 400,000 acres.
Two residences, as well as a number of outbuildings were destroyed, too,
but there have been no serious injuries or fatalities."
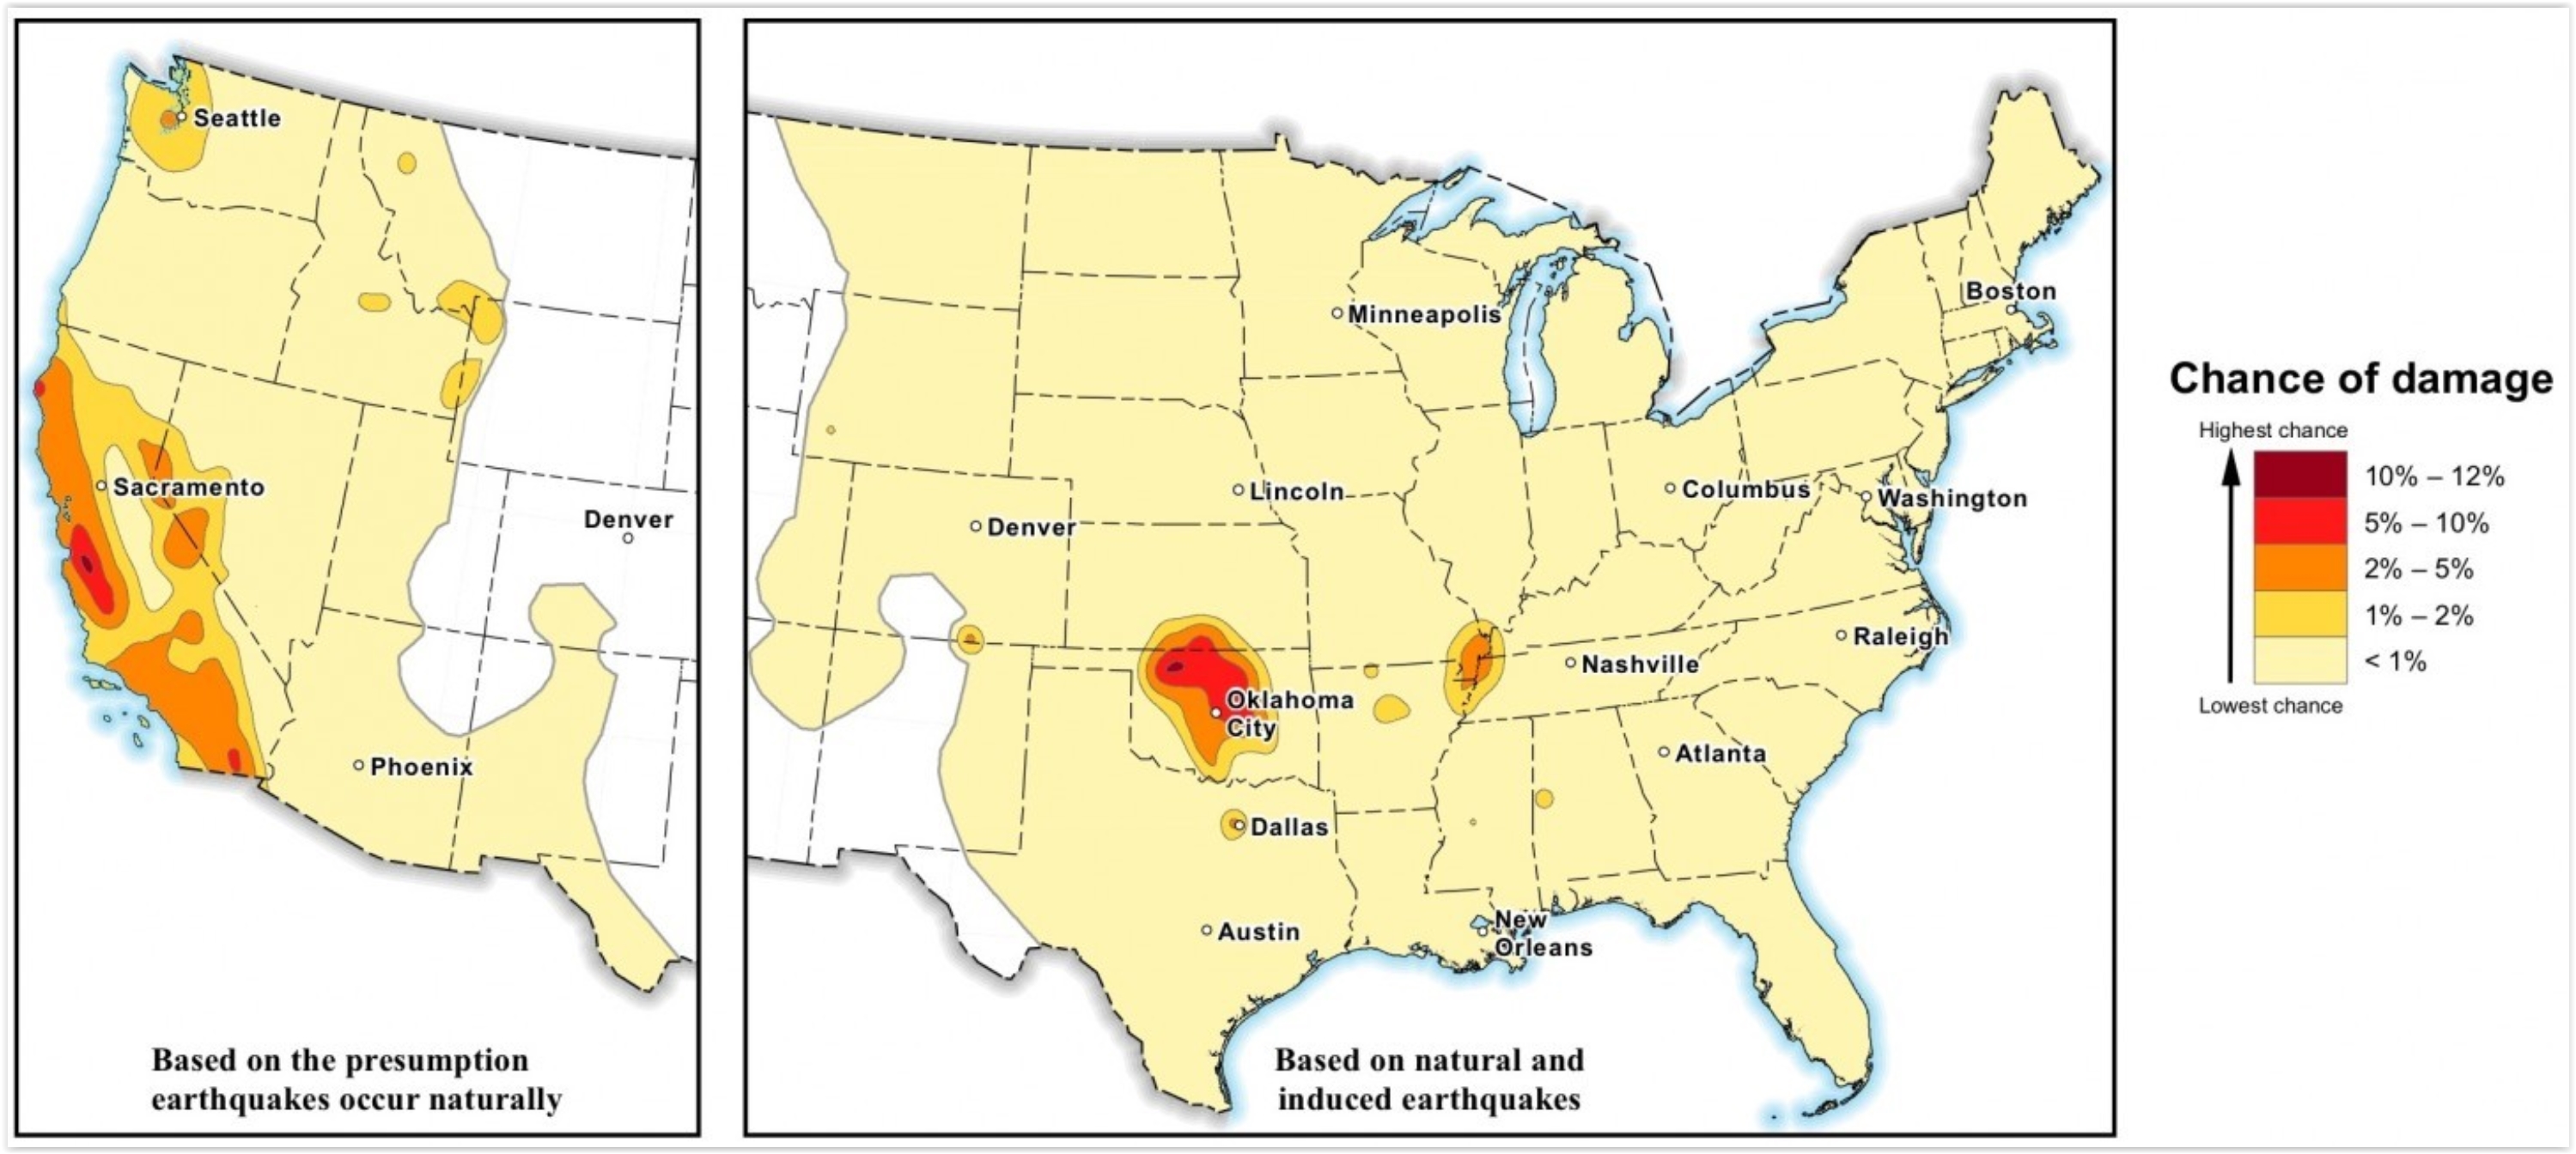
7 Million Americans at Risk of Man-Made Earthquakes, USGS Says.
The Washington Post has the story - here's an excerpt: "...
On Monday, the U.S. Geological Survey published for the first time
an earthquake hazard map covering both natural and "induced" quakes.
The map and an accompanying report indicate that parts of the central
United States now face a ground-shaking hazard equal to the famously
unstable terrain of California. Some 7 million people live in places
vulnerable to these induced tremors, the USGS concluded. The list of
places at highest risk of man-made earthquakes includes Oklahoma,
Kansas, Texas, Arkansas, Colorado, New Mexico, Ohio and Alabama..."
Map credit: "U.S.
Geological Survey map shows the potential for Americans to experience
damage from natural or human-induced earthquakes in 2016. Changes range
from less than 1 percent to 12 percent."(Courtesy of USGS).
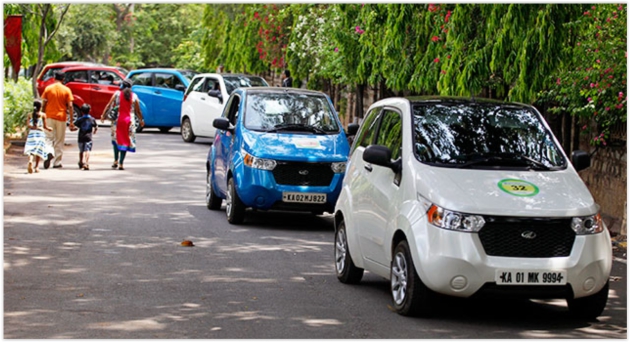
After The Tesla Model 3 Launches This Week, The World Will Know if Elon Musk Called the Electric-Car Future Correctly. Here's a snippet from Quartz: "...On
March 31, Musk will finally unveil the car that he has always
promised—the mass-market vehicle meant to be the big-bang for electrics.
It’s the Model 3, a $35,000 sedan that will go at least 200 miles on a
single charge. The positioning is deliberate—at half the base price of
his two luxury models, it’s around the average cost for new cars in the
US; and the distance is thought sufficient to alleviate most cases of
so-called range anxiety, the fear of becoming stranded with a dead
battery. Although Tesla has maintained tight secrecy around the car,
predictions call for the Model 3 to be crammed with technology including
autonomous functionality, and to feature Musk’s usual exquisite
styling..."
India Wants 100% of Vehicles to be Electric by 2030.
Greentech Media has the article; here's a clip: "
The
Indian government is working on a scheme to provide electric cars with
zero down payment, for which people can pay out of their savings on
expensive fossil fuels, with the aim of becoming a 100 percent electric
vehicle nation by 2030. "India can become the first country of its size
which will run 100 percent of electric vehicles. We are trying to make
this program self-financing. We don't need one rupee of support from the
government. We don't need one rupee of investment from the people of
India," Power Minister Piyush Goyal said at an event organized by CII
Young India..."
Do You Live In A Bubble? The PBS NewsHour
(which I watch every night - best network news out there right now in
my humble opinion, although I am still a Lester Hold/NBC News fan as
well) has a quiz to see just how big your bubble is. Go ahead, give it a
shot: "
Do you live in a bubble? There exists a new upper class
that’s completely disconnected from the average American and American
culture at large, argues Charles Murray, a libertarian political
scientist and author. Take this 25-question quiz, based on a similar one
published in Murray’s 2012 book, “Coming Apart: The State of White
America 1960-2010,” to find out just how thick your bubble is..."
How Free Trade Made America Great.
The Wall Street Journal has a transcript of recent remarks from Fred Smith, Founder and CEO of FedEx; here's an excerpt: "...
More
than three billion people are now connected to the Internet. Billions
more have aspirations for a better life and are likely to come online as
global consumers. The odds are good, therefore, that today’s remarkable
transport systems and technologies will continue to improve and
facilitate an even larger global economy as individual trade is becoming
almost “frictionless.” History shows that trade made easy, affordable
and fast—political obstacles notwithstanding—always begets more trade,
more jobs, more prosperity. From clipper ships to the computer age,
despite economic cycles, conflict and shifting demographics, humans have
demonstrated an innate desire to travel and trade. Given this, the
future is unlikely to diverge from the arc of the past..."
Climate Change Opens Up The First Luxury Arctic Cruise Route.
If you are morbidly curious about the loss of arctic ice and have a
spare 22K burning a hole in your pocket, check out details at
WIRED: "...
The
loss of Arctic sea ice cover, due to climate change, has spurred a
sharp rise in shipping traffic—as well as coast guard rescue
missions—and increased the risks of oil spills, shipping accidents, and
pollution, much to the apprehension of native communities who make their
living on the ice. It’s into these turbulent waters that the luxury
cruise ship Crystal Serenity will set sail next August, departing from
Seward, Alaska, and transiting the Bering Strait and Northwest Passage,
before docking in New York City 32 days later..."
Photo credit: "
The Crystal Serenity at sea".
Crystal Cruises.
TODAY: Periods of rain likely. Winds: SE 8-13. High: 50
WEDNESDAY NIGHT: More rain. Low: 38
THURSDAY: Showers taper, a bit raw out there. Winds: N 10-15. High: 46
FRIDAY: Mostly cloudy, few flakes around. Winds: NW 10-20. Wake-up: 33. High: near 40
SATURDAY: Clipper. Gusty winds, flurries. Winds: NW 15-30. Wake-up: 31. High: 39
SUNDAY: Light mix possible, no accumulation. Winds: NW 10-15. Wake-up: 30. High: 38
MONDAY: Mostly cloudy, still chilly. Winds: NW 7-12. Wake-up: 28. High: 39
TUESDAY: Vague hints of spring return. Milder under partly sunny skies. Winds: S 10-15. Wake-up: 30. High: near 50
Climate Stories...
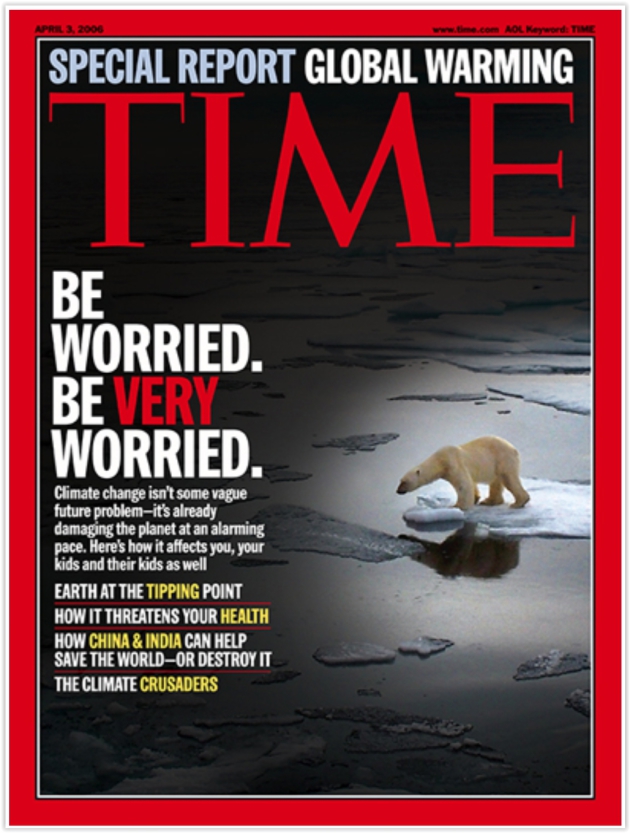
Time Magazine Got Global Warming Right in 2016: "Be Worried, Be Very Worried". We should be perpetually paranoid - and simultaneously empowered to do something about it. Here's a clip from
ThinkProgress: "...
Indeed,
Time warned that “global climate systems are booby-trapped with tipping
points and feedback loops, thresholds past which the slow creep of
environmental decay gives way to sudden and self-perpetuating collapse” —
tipping points that a decade of inaction has brought us right to the edge
of. The article even warns of the possible ramifications if warming
shuts down the Gulf Stream or if our dawdling locks in multi-meter sea
level rise — much the same concerns that James Hansen and 18 leading
climatologists warned of in their recent bombshell
peer-reviewed paper. Except Time magazine laid it all out for all
Americans to see 10 years ago when the possibility of avoiding the worst
impact would have been far easier to achieve..."
The End of Climate Denial? An article at
Huffington Post left me hopeful that common sense and pragmatism will prevail; here's a clip: "...
Rumors
have persisted that there are Republicans in Congress who acknowledge
the climate crisis but have been afraid to say so. Now, some are
breaking ranks. A dozen Republicans have signed a House Resolution
that acknowledges the adverse impacts of climate change on weather,
national security, economic productivity, the environment, government
spending, and every region of the United States. “There is increasing
recognition that we can and must take meaningful and responsible action
now to address this issue,” the resolution says. Also in the House, a
Republican and a Democrat have teamed up to create the body’s first
Climate Solutions Caucus to explore economically viable solutions to
global warming. The Democrat, Rep. Ted Deutch of Florida, hoped the
Caucus “sends a powerful message not just to our colleagues in the house
but to the American people that a bipartisan dialogue on climate change
is actually possible...” (File photo: Matt Brown).
Jets vs. the Jet Stream. I've
seen research suggesting a weakening of jet stream winds as the arctic
region warms faster than mid-latitudes. The jury is still out, but this
excerpt at
The Guardian caught my eye: "...
And the effect of a powerful jet stream was brought home in a remarkable flight in January last year,
when a British Airways flight from New York to London reached 745mph,
near supersonic speed, by riding on an exceptionally fast jet stream of around 250mph.
Airlines face other troubles as the climate warms. Planes taking off in
hot weather need to reach higher speeds, because warm air is less dense
than cold air. That means aircraft having to travel lighter, with fewer
passengers or less cargo. Since 1980, the number of flights forced to
cut their loads increased at four airports studied in the US, as average
temperatures rose at each location..."
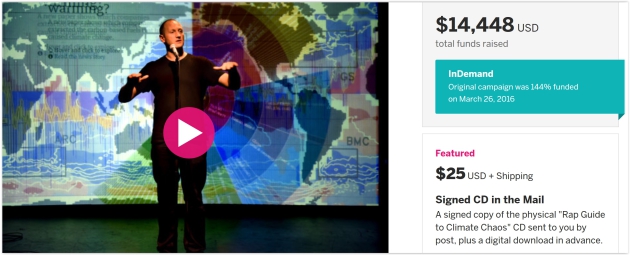
Baba Brinkman Unleashes Rap's Fury on Climate Change Deniers. Here's the intro to a story at
Inverse: "
For Baba Brinkman,
the world’s only peer-reviewed rapper, the term “climate change sounds
so benign.” The world is not facing a smooth transition to warmer,
longer summers. We’re looking at the destruction of our planet as we
know it. This is climate chaos. And maybe if we can’t convey the drama
of the situation in a name, we need a whole set of new tactics. Baba’s
suggestion: How about rap? His Rap Guide to Climate Chaos just hit its funding goal on Indiegogo.
And coming off performances at those 2015 UN climate talks in Paris,
Baba is ready to spread the gospel of climatology and excite a global
response..."
Climate Skepticism Has Lost Major Ground Among Weather Experts. It's becoming increasingly difficult to dismiss or deny the evidence all around us; here's the intro to a
ThinkProgress story: "
Among climate scientists, there’s a consensus
that climate change is real and driven by human activity. Among
meteorologists and weathercasters, however, that acceptance of climate
science has historically been harder to find. That may have finally
changed. Some 99 percent of U.S. weathercasters — those who communicate
weather forecasts on TV or radio, but who aren’t always trained meteorologists
— accept the fact that climate change is happening, according to
preliminary findings from a George Mason University’s Center for Climate
Change Communication study released Thursday. The study, which has yet
to go through the peer review process, comes days after George Mason
University released a similar survey that shows that some 96 percent of American Meteorological Society members think climate change is real..."
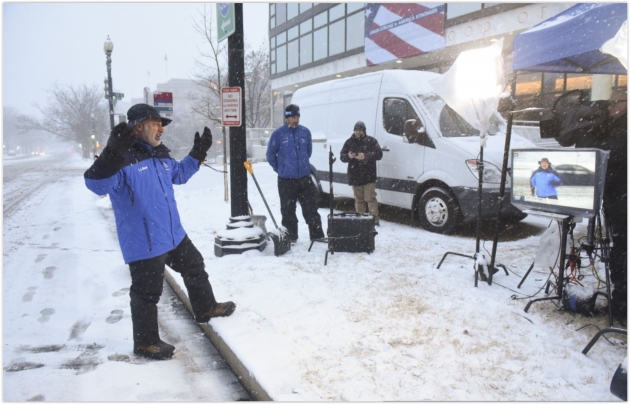
Photo credit above: Kevin Wolf/AP. Images for the Weather Channel. "
Jim Cantore, The Weather Channel on-camera meteorologist and storm tracker, reports on Winter Storm Jonas in Washington, D.C."
 New Survey Finds a Growing Climate Consensus Among Meteorologists
. Here's a snippet from Dr. John Abraham at
The Guardian: "...
Another
important finding is that most meteorologists feel that some of the
change can be averted, based on how we react. Small minorities felt that
a large amount of change can be averted or that climate change cannot
be averted. These views have changed over the years. For instance,
almost 20% of meteorologists say their opinion on climate has changed
over the past five years. Of that group, the vast majority are more
convinced that the climate is changing and they cite a variety of
reasons including new research, seeing first-hand evidence, the
consensus amongst climate scientists, or from interactions with climate
scientists. A final important result is that only 37% of the AMS
respondents consider themselves climate experts..."
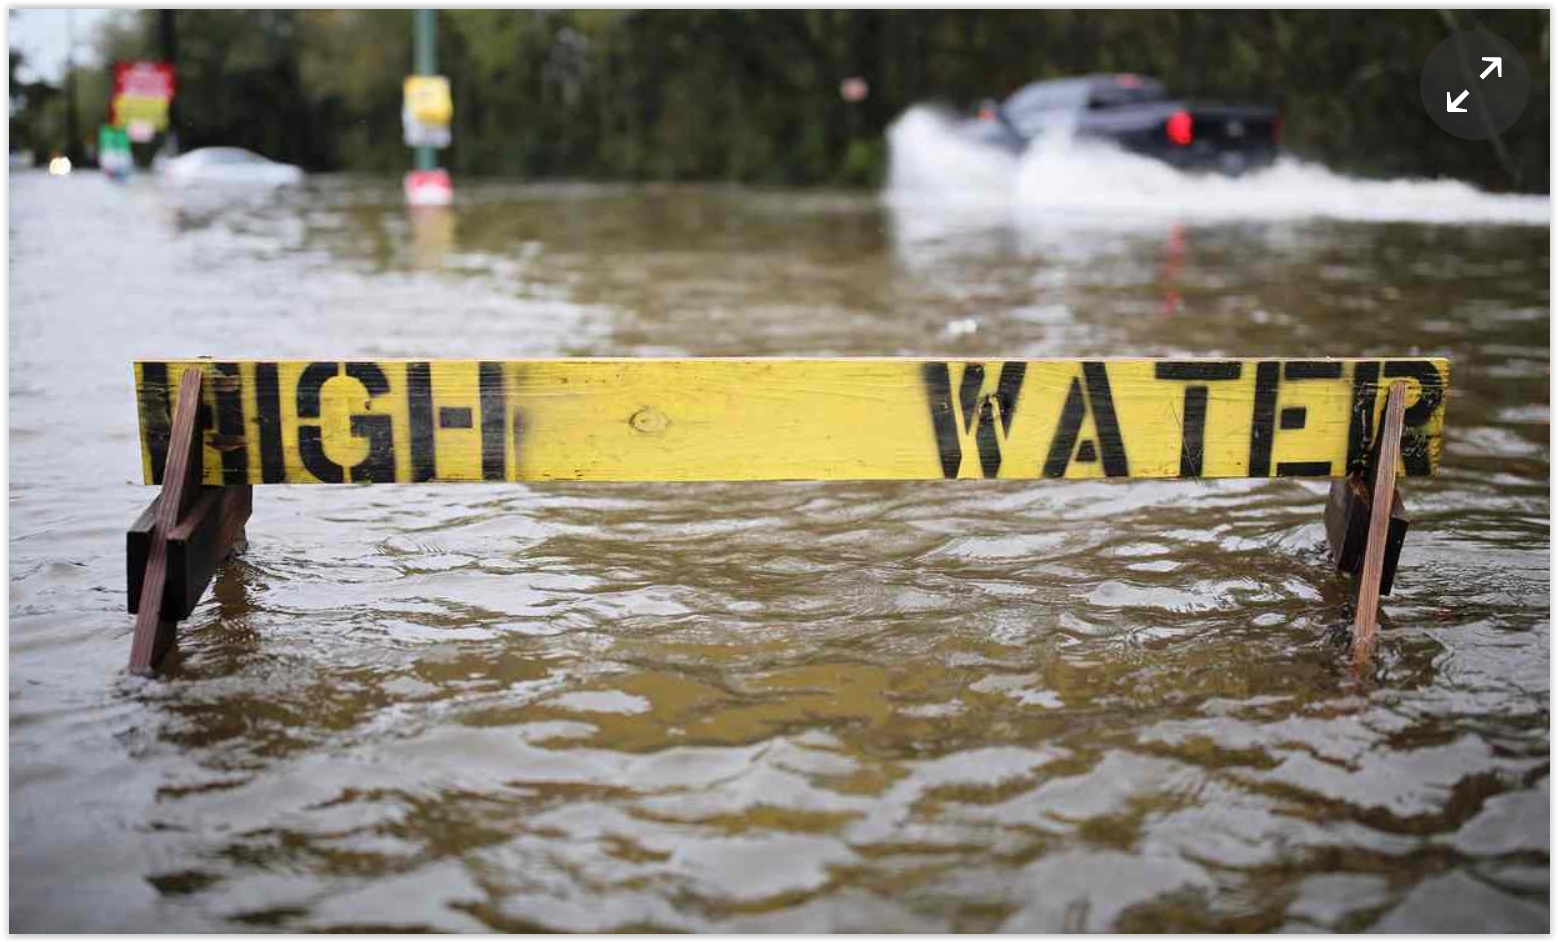
Photo credit above: "
Cars
drive through flooded streets behind a High Water sign in Hammond,
Louisiana, USA, 11 March 2016. As climate change leads to more extreme
weather, more meteorologists will likely take notice." Photograph: Dan Anderson/EPA.
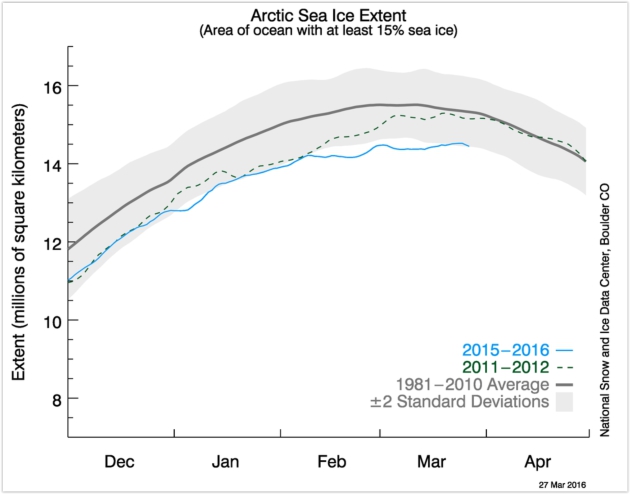
Arctic Sea Ice Sets Wintertime Record Low Thanks to Global Warming. No, it wasn't El Nino - at least as far as we know. Something else was heating up arctic waters. Here's an excerpt from
KING5.com in Seattle: "
Arctic
sea ice set a record wintertime low for the second straight year
because of global warming, scientists at the National Snow and Ice Data
Center and NASA announced Monday. “I’ve never seen such a warm, crazy
winter in the Arctic,” data center director Mark Serreze said in a
statement. “The heat was relentless.” Arctic temperatures this winter
were up to 15 degrees higher than average, according to NASA..."
Graphic above courtesy of
The National Snow and Ice Data Center, which has more details on the record winter ice minimum in the arctic.
 How To Talk Global Warming in Plain English
. Some good advice from ClimateWire and
Scientific American; here's an excerpt: "...
It’s
time, many of its past authors say, to consider shifting the assessment
away from being a document that tells people what scientists do and do
not know about climate change and its risks, and toward something more
interactive. Something, many scientists said last week, that explicitly
lays out how much time people have to plan, prepare and even pay for the
inevitable adaptation. “We could make the goal that it should change
the public discourse,” said Susanne Moser, a California-based scientist
who worked on the coastal chapter of the last assessment and who studies
ways of helping people understand the challenges and risks of climate
change. “Do not tell me just how high the sea-level rise is going to
get. Tell me how much time I have to solve a very tough problem...”
Primary Debate Scorecard: Climate Change Through 20 Presidential Debates. Future generations may scratch their heads in wonder. Here's an excerpt at
Media Matters: "
With 20
presidential primary debates now completed, debate moderators have only
asked 22 questions about climate change, which is just 1.5 percent of
the 1,477 questions posed. In addition, the moderators were more than
twice as likely to ask a climate question to a Democratic candidate than
to a Republican candidate, and they have not asked a single climate
question to Donald Trump or Ted Cruz, the two front-runners for the GOP
presidential nomination. Nearly one-third of the climate questions were
asked in the two most recent debates in Miami, following a bipartisan
group of 21 Florida mayors urging the networks to address the issue in
those debates. Just 1.5 percent Of Presidential Debate Questions were
about climate change.."


No comments:
Post a Comment