23 F. average high on December 20.
35 F. high on December 20, 2015.
December 21, 1993: Strong northwest winds gust to 35 miles an hour, causing near whiteout conditions over a wide area of southwest Minnesota from the late afternoon on the 21st into the early morning of the 22nd. Several car accidents occurred. A 30 year old man was killed when he lost control of his truck and slid into a ditch in the near blizzard like conditions. Counties affected include: Blue Earth, Brown, Chippewa, Faribault, Lac Qui Parle, Redwood, Renville, Watonwan, and Yellow Medicine.
December 21, 1939: This is the latest date on record for Lake Minnewaska to freeze over at Glenwood.
Welcome Winter Solstice! A Rainy Christmas Day
It isn't the cold, or even the snow and ice that depresses so many people this time of year. It's a dire lack of daylight, sunshine, all-natural vitamin D, that makes so many of us want to curl up into a fetal position.
According to the Mayo Clinic, symptoms of SAD (Seasonal Affective Disorder) include depression, hopelessness, low energy, irritability, oversleeping, craving carbohydrates and weight gain.
Sitting in front of a "light box" that mimics the sun for 30 minutes can help. So can melatonin. You don't have to suffer - see a doctor to find the right solution for you.
It turns out decorating evergreen trees, yule logs and mistletoe are vestiges of ancient pagan celebrations of the Winter Solstice.
Relatively mild weather lingers all week with a light mix Friday. No travel problems on Christmas Eve, but a big storm taking a western track will pull enough mild air into Minnesota for mostly-rain Christmas Day, after a very icy start.
Today at 4:44 AM the sun's rays hit the Tropic of Capricorn, in the southern hemisphere. Daylight tomorrow will be 3 seconds longer!
Image credit above: NASA JPL.
Symptoms of Seasonal Affective Disorder. Here's an excerpt from The Mayo Clinic focused on symptoms of "SAD", which can result in both physical and mental: "Symptoms specific to winter-onset SAD, sometimes called winter depression, may include:
- Irritability
- Tiredness or low energy
- Problems getting along with other people
- Hypersensitivity to rejection
- Heavy, "leaden" feeling in the arms or legs
- Oversleeping
- Appetite changes, especially a craving for foods high in carbohydrates
- Weight gain
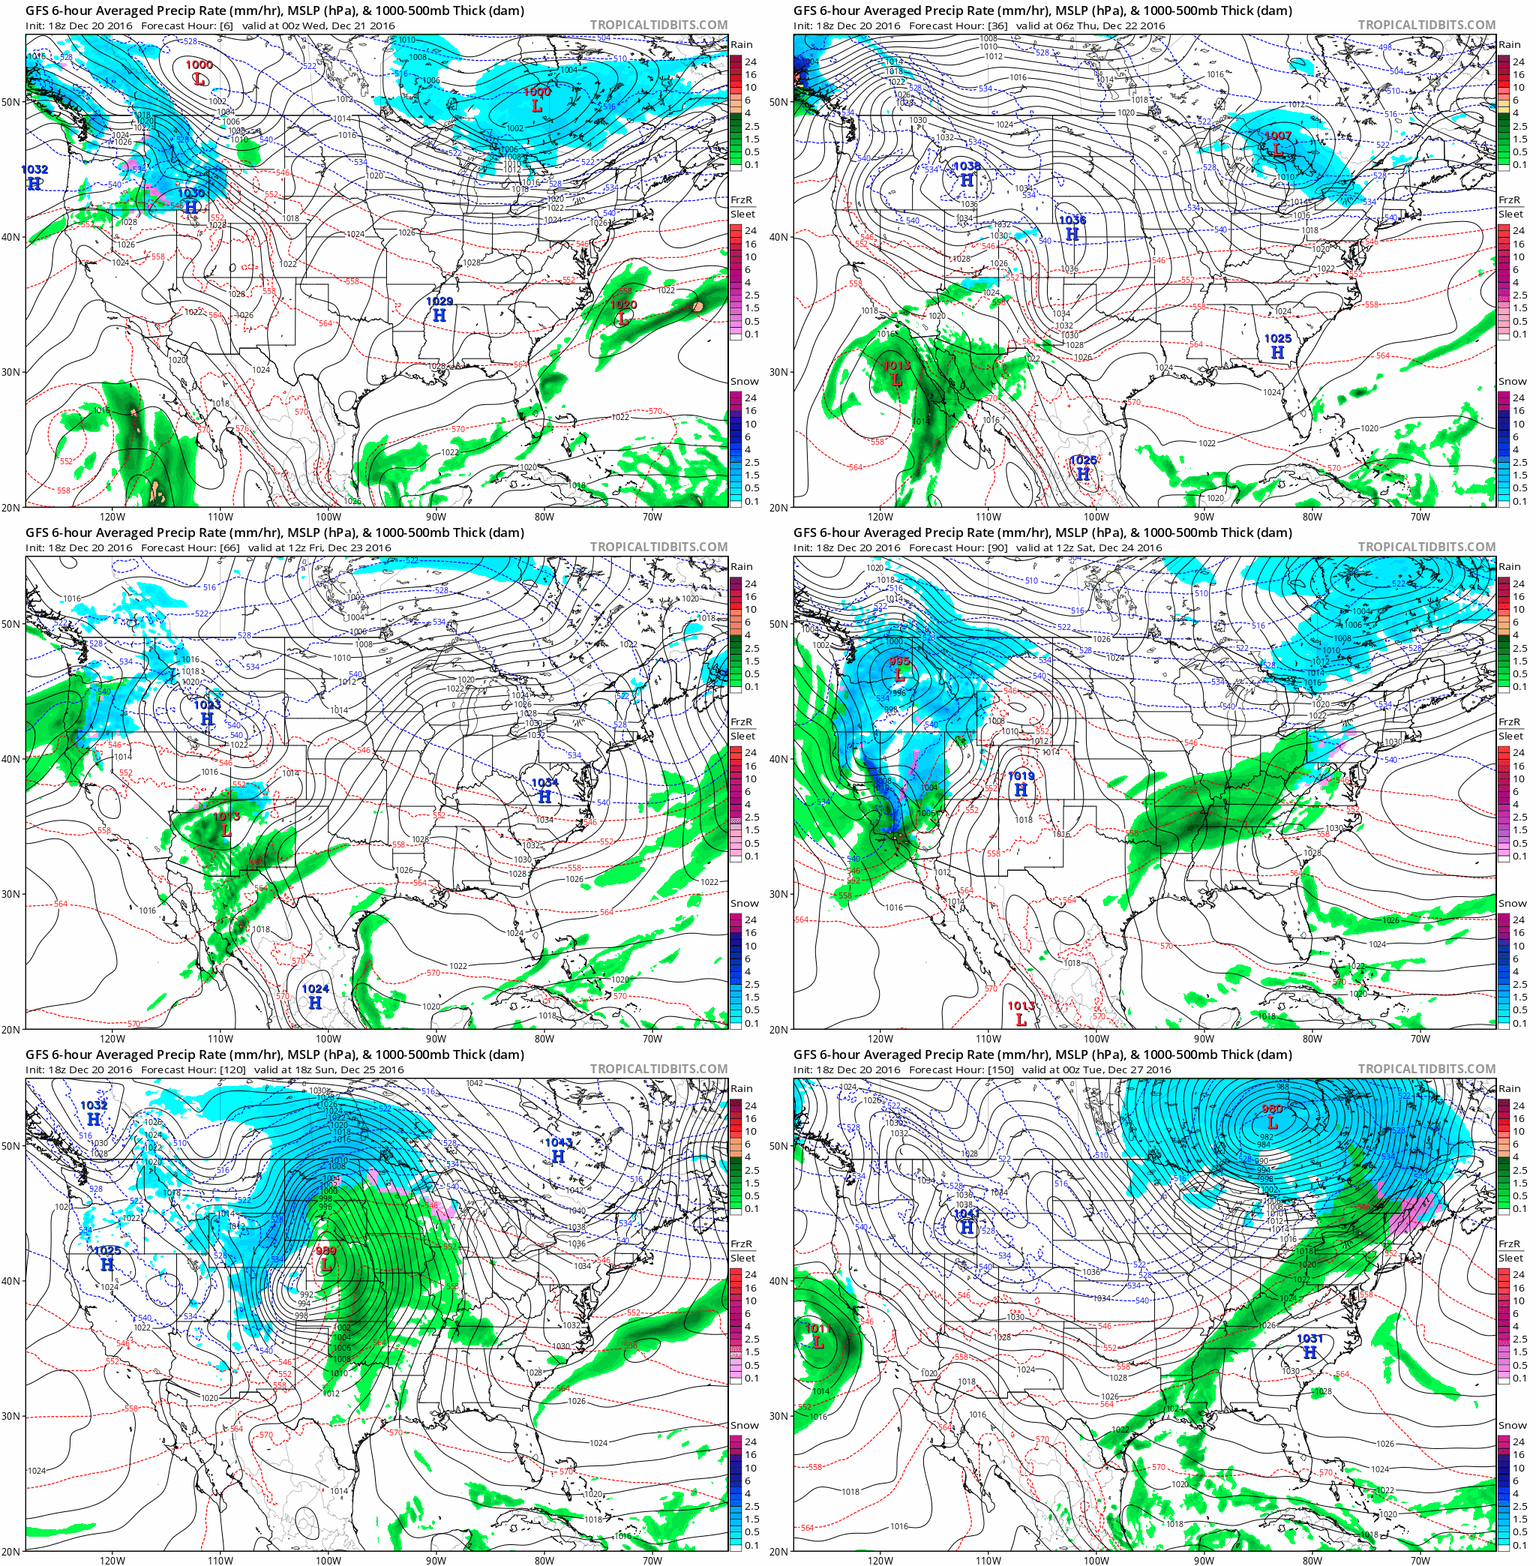
It's A Good Thing Santa Has Rain-Deer. I know, I know, the typo is intentional - just trying to make a point. GFS Future Radar (above) is color-coded; areas of rain in green, snow in blue. A major storm spins up over the Plains and tracks toward the Upper Midwest Christmas Day, pulling enough warm air into its circulation for a cold rain for much of the Midwest. Get out and play in the snow - by Monday it may be slushy, mushy and icy. Animation credit: Tropicaltidbits.com
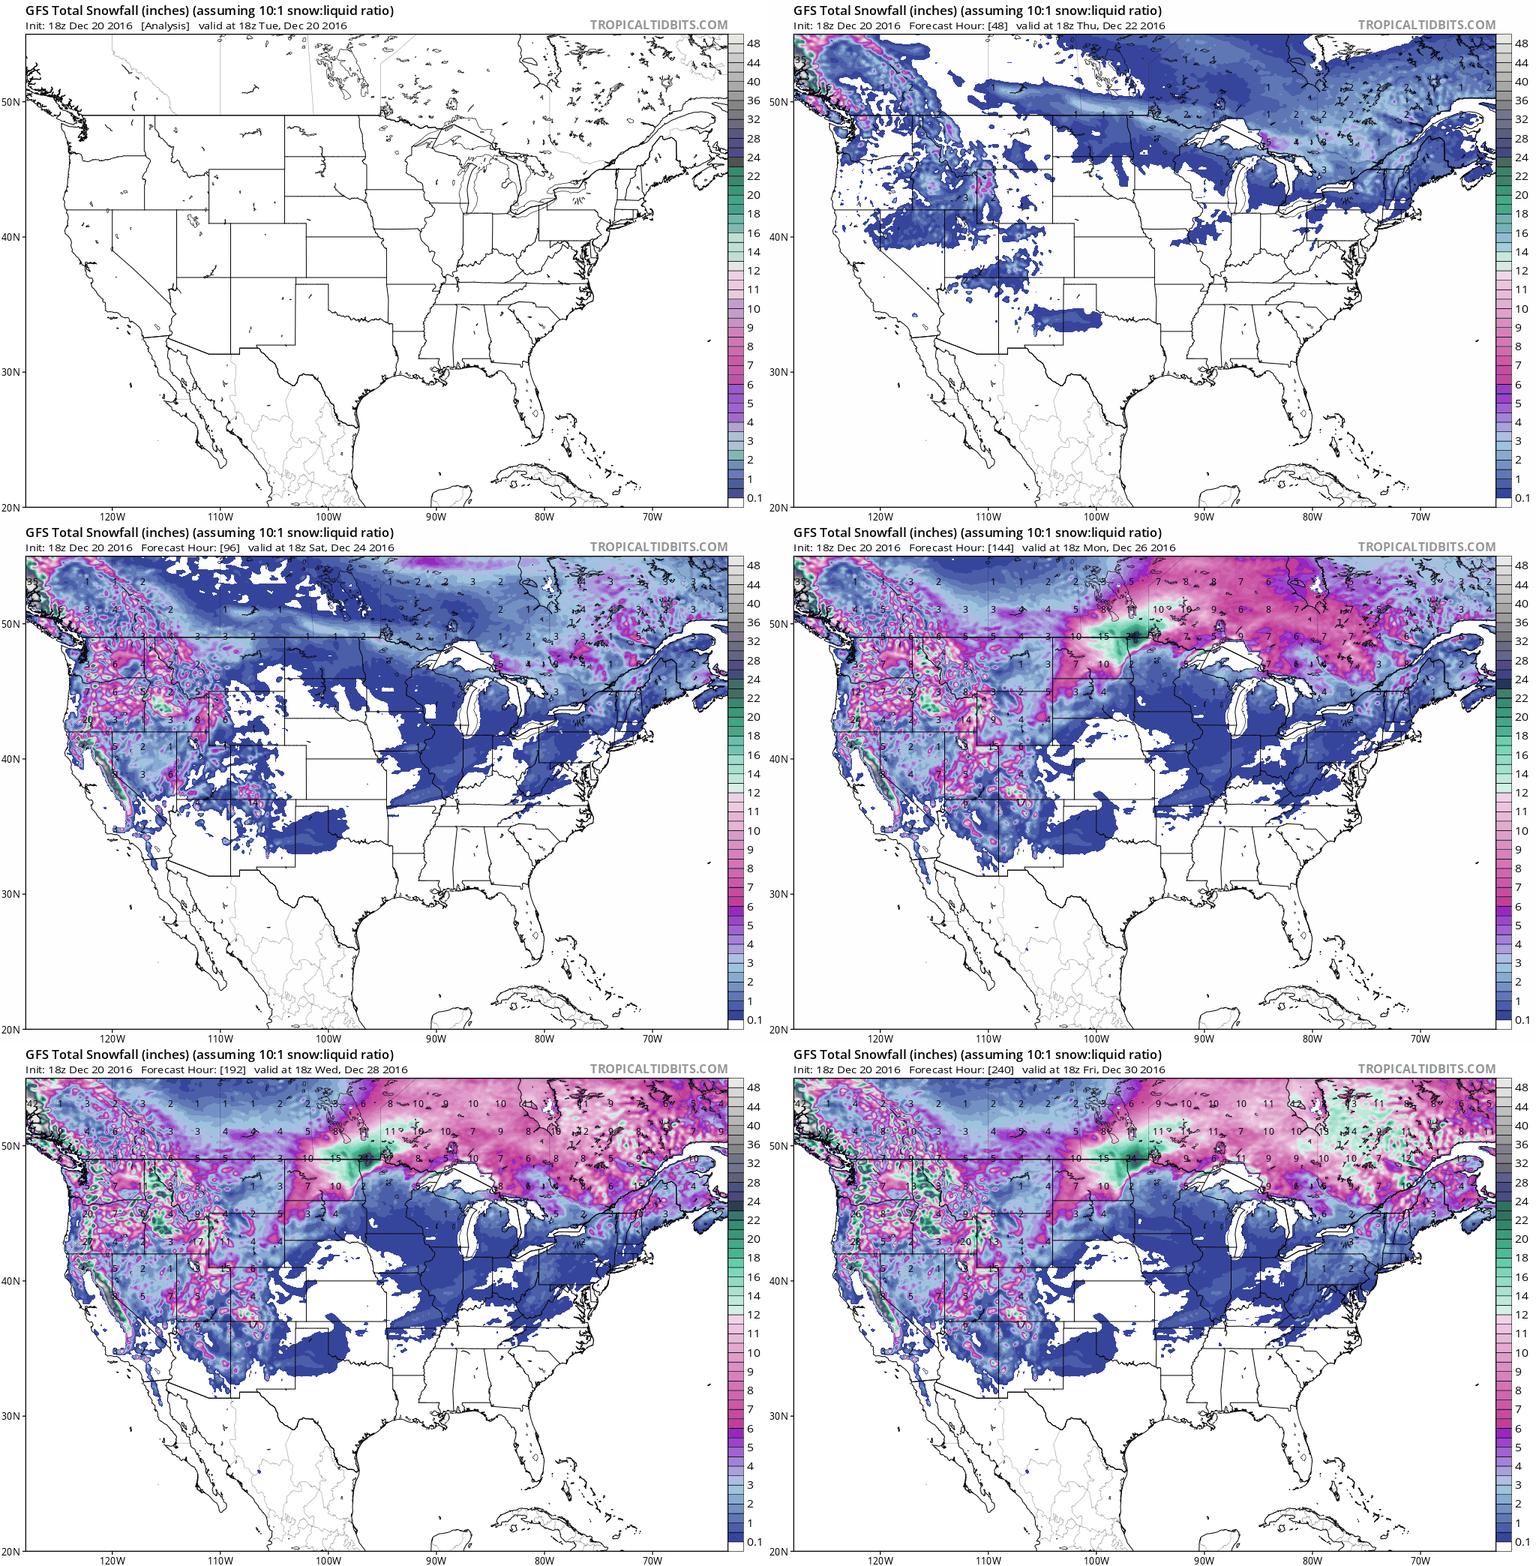
10-Day Snowfall Potential. Sunday's storm may dump 1-2 feet of snow on eastern North Dakota and the Red River Valley of northwestern Minnesota. Otherwise it will be too warm for heavy snow Christmas Day. Minor accumulations are possible downwind of the Great Lakes after Christmas.
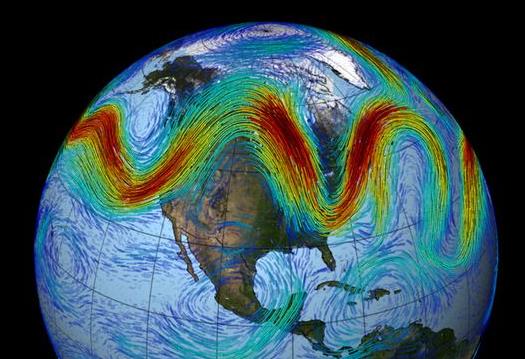
Early January: Cold and Stormy East, Relatively Mild Western USA. Looking out roughly 2 weeks GFS guidance shows a longwave trough over the Great Lakes and New England, increasing the potential for significant snows, even a few Nor'easters? Meanwhile relatively dry, mild weather prevails over the western half of the USA.
January 2017 Preview: Milder for Much of USA? This is a low-confidence outlook, but recent runs on NOAA's CFSv2 climate model have been trending milder for the USA and Canada as Polar Vortex winds are forecast to strengthen, keeping the coldest air bottled up over northern Canada. This is more of a curiosity than an actual forecast, but we'll keep peering over the horizon to see if long-range forecasts are consistent (or just plain flaky). Map: WeatherBell.
Freakish Warmth Continues In The Arctic - 50F Warmer Than Average by Thursday. Here's an excerpt from Jason Samenow at Capital Weather Gang: "It’s not normal, and it’s happening again. For the second year in a row in late December and for the second time in as many months, temperatures in the high Arctic will be freakishly high compared to normal. Computer models project that on Thursday, three days before Christmas, the temperature near the North Pole will be an astronomical 40-50 degrees warmer-than-normal and approaching 32 degrees, the melting point..." (Map: Climate Reanalyzer).
5th Warmest November on Record, Worldwide. We're also on track for 2016 to be the warmest year on record, warmer than 2015 and 2014. Here's an excerpt from NOAA NCDC:
- The November temperature across global land and ocean surfaces was 1.31°F above the 20th century average of 55.2°F. This was the fifth highest for November in the 1880–2016 record, 0.41°F cooler than the record warmth of November 2015 when El Niño conditions were strong.
- The November globally averaged land surface temperature was 1.71°F above the 20th century average of 42.6°F. This value was the 12th highest November land global temperature in the 1880–2016 record....
Map credit "Researchers at The Ohio State University, University of Michigan and Texas A&M have developed a computer model to forecast power outages caused by hurricanes. The model uses NASA's Soil Moisture Active Passive (SMAP) satellite to pinpoint where trees are more likely to contact power lines during severe weather." Credit: Courtesy of The Ohio State University.
Where Are Forecasts Most Accurate in the USA? Perception becomes reality. I found this to an interesting nugget, courtesy of Peter Kennedy's Daily Devotional: "CNBC
looked at how eight meteorological services predicted temperatures and
rain across the United States. They found the top two overall were
Weather Underground and the Weather Channel with almost an 84% chance of
accuracy. Places like Florida, California and Alaska are easier to
forecast with high accuracy. In California, apps predicted rain (or more
likely, no rain) in some areas with more than 97 percent accuracy in
2015. Likewise, temperature forecasts are strongest in Florida. Overall,
the hardest states to predict the weather in are North Dakota and
Montana, where apps are only right about 64 percent of the time.
Additionally, what is perceived as accurate can change depending on how
you use a service. That's why some weather services have been known to
adjust their predictions to better serve their customers. One famous
example is the "wet bias" — when a forecaster reports a higher
probability of rain than his or her models suggest to help keep people
from getting wet if it does rain. The logic is that if consumers see
that rain is unlikely and get wet, they'll be a lot angrier than if they
see that rain is more likely and it doesn't rain. "Sometimes a less
accurate forecast is perceived as being a better forecast," said Eric
Floehr, the founder of ForecastAdvisor...."
Timeline of Gatlinburg Wildfires. It reads like something out of a horror movie, but it's documentation of what really happened, courtesy of The Tennessean. (Image credit: NASA).
China Chokes on Smog So Bad That Planes Can't Land. Here's an excerpt from cincinnati.com: "Major
cities across northern China choked Monday under a blanket of smog so
thick that industries were ordered shut down and air and ground traffic
was disrupted. At least 23 cities issued red alerts for a swath of
pollution that has hovered over much of the nation since Friday, China's
Xinhua news agency reported. Alerts are expected to remain in effect
through Wednesday. Hospitals set emergency procedures in motion to deal
with an influx of breathing-related illnesses..."
Photo credit: "Haze envelops the Forbidden City in Beijing, China, on Dec. 19, 2016." (Photo: Wu Hong, EPA)
China Smog Alerts Signal New Outlook.
I was just in Beijing and Tangshan, and I've never experienced that
level of air pollution - anytime, anywhere (and I was in Pittsburgh in
the 60s). It quite literally takes your breath away, and in my case, it
made me sick. It was a reminder to never take clean air for granted.
Here's an excerpt from The Wall Street Journal: "Cities
across northern China maintained air-pollution measures on Monday after
issuing a series of red alerts over the weekend, signaling a new
willingness to pay an economic price for cleaner air. With thick, yellow
air smothering three provinces as coal-fired power plants ramp up to
generate heat, the official Xinhua News Agency said more than 20 cities
in the region have joined Beijing in issuing red alerts since Friday,
triggering restrictions on factories and traffic..."
File photo: I snapped this photo of the Beijing skyline from my hotel room on December 3, 2016.
How Bad Air Came Back. Here's more perspective from TIME: "...Delhi
ranks high on a World Health Organization (WHO) list of cities with
unhealthy levels of air pollution, but it is far from alone. WHO
research found that 90% of the world’s population lives in areas with
unsafe air-pollution levels. And it’s not just cities in the developing
world, like Beijing, that face dirty air–Western metropolises like New
York City and London are on the list as well. At the beginning of
December, Paris was hit by some of the worst air pollution in a decade,
leaving the Eiffel Tower cloaked in smog. For all the deserved focus on
climate change as the planet’s major environmental threat, a much older
one–bad air–is still a persistent danger. Economic growth in places like
Delhi and Beijing has led to the rapid construction of coal-fired power
plants, quick factory construction and traffic-choked streets.
Regulations–to the extent that they exist in these places–receive little
attention from the officials charged with enforcing them..."
Photo credit: Adnan Abidi—Reuters. "Children play on a smoggy day in New Delhi, where thousands die early from air pollution yearly."
Image credit: "Google Earth's time-lapse videos show see how the planet's surface has changed over time — like the evaporation of the Aral Sea (above)." YouTube/Screenshot by NPR
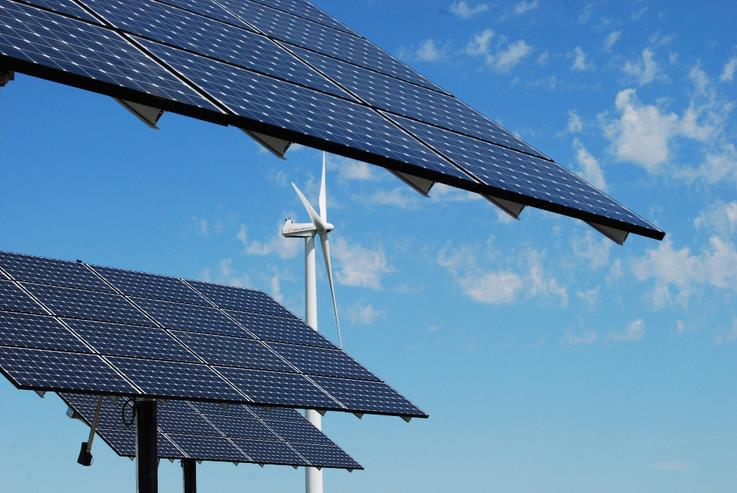
Republicans and Democrats Alike Want More Clean Energy. Dr. John Abraham at The University of St. Thomas reports for The Guardian: "...A fascinating study was just released by Yale and George Mason Universities that involved a national survey of American opinions. What this survey found was astonishing. Almost 70% of registered voters in the U.S. believe that their country should participate in international agreements to limit global warming. Only 1 in 8 registered voters believe the U.S. should not participate in such agreements. Similarly, 70% of respondents support limits on carbon dioxide, the most important human-emitted heat trapping gas. Moreover, they agree to limits even if that means electricity costs will increase (although they won’t). What this means is that 7 in 10 registered voters agree with President Obama’s signature climate accomplishment, the Clean Power Plan..." (File photo: MN.gov).
Las Vegas's City Government Is Now Powered by 100% Renewable Energy, And More Cities Will Follow. Quartz has the story: "Ten years of effort finally paid off for Las Vegas this week when officials announced the city government will now be powered entirely by renewable energy. After a large solar array, Boulder Solar 1, came online on Dec. 12, the city was able to buy enough carbon-free electricity to power its 140 buildings, streetlights and other facilities. The power flows from a mix of solar panels and hydroelectric turbines including the Hoover Dam. The renewables, plus energy efficiency savings, are estimated to save the city roughly $5 million per year, reports the Las Vegas Review-Journal. Las Vegas is one of many cities pushing ahead with aggressive efforts to leave fossil fuels behind..."
Photo credit: "How Las Vegas wants to power its neon." (Jason Reed / Reuters)
ISU Study Finds Wind Turbines Have Some Impact on Crop Fields. Radio Iowa has the story; here's an excerpt: "...One result of the changes could be less dew forming on the plants. “Which would be generally a good thing because dew promotes growth of fungus and mold and some pathogens that crops are generally affected by,” Takle says. He says they found the turbines slowed the wind over the fields. “And this in meteorological terms that leads to a surface convergence. And that means that by laws of physics that there must be an upward motion over the windfarm,” Takle says. “..and it could have significance in that it could affect fog and cloudiness or rainfall if it is on a large enough scale.” The research was done behind a couple of rows of turbines. “We have not gone to look at the regional scale say of 150 or 200 turbines, the impact that might have,” Takle says. “But that is an very interesting question and one that we are pursuing, because it could have some significance...” (File photo: AP).
TODAY: More clouds, flurries. Winds: SW 8-13. High: 35
WEDNESDAY NIGHT: Flurries taper. Low: 20
THURSDAY: Partly sunny - almost pleasant. Winds: SW 7-12. High: 34
FRIDAY: Chance of a light mix, wet roads. Winds: S 10-15. Wake-up: 24. High: 36
CHRISTMAS EVE: Mostly cloudy, dry for Santa's arrival. Winds: E 5-10. Wake-up: 23. High: 31
CHRISTMAS DAY: Icy start, then rain - heavy at times. Possible T-storms. Winds: SE 15-25. Wake-up: 26. High: 46
MONDAY: Blustery, colder - few flurries. Temperatures tumble. Winds: NW 20-40. Wake-up: 33. High: 34
TUESDAY: Partly sunny, seasonably chilly again. Winds: W 7-12. Wake-up: 20. High: 25
Image credit: NASA and UW - Madison CIMSS.
Climate Stories...
Obama Bans Drilling in Parts of the Atlantic and the Arctic. The New York Times reports: "President Obama announced on Tuesday what he called a permanent ban on offshore oil
and gas drilling along wide areas of the Arctic and the Atlantic
Seaboard as he tried to nail down an environmental legacy that cannot
quickly be reversed by Donald J. Trump. Mr. Obama invoked an obscure
provision of a 1953 law, the Outer Continental Shelf Lands Act,
which he said gives him the authority to act unilaterally. While some
presidents have used that law to temporarily protect smaller portions of
federal waters, Mr. Obama’s declaration of a permanent drilling ban
from Virginia to Maine on the Atlantic and along much of Alaska’s coast
is breaking new ground. The declaration’s fate will almost certainly be
decided by the federal courts..."
Photo credit: "The
Polar Pioneer was the first of two oil drilling rigs Royal Dutch Shell
was outfitting for Arctic oil exploration before the company ended its
contract last year." Credit Elaine Thompson/Associated Press.
El Nino on a Warming Planet May Have Sparked the Zika Epidemic, Scientists Say. Alarmist hype or is there a causal connection? Here's a clip from The Washington Post: "In a world characterized by rising temperatures, deforestation and other human influences on the environment, the spread of infectious disease is a hot topic. Many recent studies suggest that environmental changes can affect the transmission of everything from malaria to the Zika virus — and it’s increasingly important to understand these links, scientists say. This week, a new study has provided new evidence that environmental changes can increase the threat of disease. It concludes that unusually warm temperatures caused by 2015’s severe El Niño event — probably compounded by ongoing climate change — may have aided in the rapid spread of the Zika virus in South America that year. And while there are many complex factors at play in the spread of mosquito-borne diseases, the study may help scientists better prepare for the kinds of future effects we might see in our warming world..."
Photo credit: "A female Aedes aegypti mosquito in the process of acquiring blood from a human host."(James Gathany/Centers for Disease Control and Prevention via AP).
The Latest Zika News is More Bad News. FiveThirtyEight has more perspective.
Image credit: "This natural-color image mosaic, provided by NASA, taken in Aug. 2015, based on data collected during two orbital passes of the Visible Infrared Imaging Radiometer Suite (VIIRS) shows typhoons in the western North Pacific. A new scientific report finds man-made climate change played some kind of role in two dozen extreme weather events around the world in 2015." (NASA via AP)

"The Arctic is Unraveling", Scientists Conclude After Latest Sobering Climate Report. Here's an excerpt from InsideClimate News: "...If
the extreme warmth recorded in the Arctic this fall persists for the
next few years, it may signal a completely new climate in the region,
scientists said.
Jeremy Mathis, director of NOAA's Arctic Research Program, said the
report highlights the clear and pronounced global warming signal in the
Arctic and its effects cascading throughout the environment, like the
spread of parasitic diseases in Arctic animals.
"We've seen a year in 2016 like we've never seen before ... with clear
acceleration of many global warming signals. The Arctic was whispering
change. Now it's not whispering. It's speaking, it's shouting change,
and the changes are large," said co-author Donald Perovich, who studies
Arctic climate at Dartmouth College..."
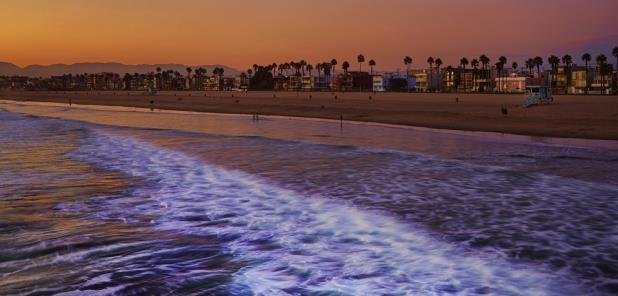
The Hardest Part of Dealing with Sea-Level Rise Will Be The Uncertainty. Vox explains: "By far one of the most important impacts of global warming in the decades ahead will be sea-level rise.
As the Earth heats up and ice sheets in Greenland and Antarctica melt,
ocean levels will creep upward, flooding coastal cities and forcing
large-scale relocations around the world. But there’s a troubling
asterisk here: We still don’t know exactly how high oceans are likely to
rise this century. Studies have suggested it could be anywhere from 2
to 6 feet, on average — with newer evidence leaning toward the higher end, depending on emissions and how quickly parts of West Antarctica’s massive ice sheet
disintegrate. Worse, climate scientists probably won’t be able to pin
down an exact number anytime soon, because getting a handle on ice-sheet
dynamics is inherently tricky..." (Photo credit: EPA).
Map credit: The Real Deal has a high-resolution version of the map showing condominiums at greatest risk in the Miami area.
No comments:
Post a Comment