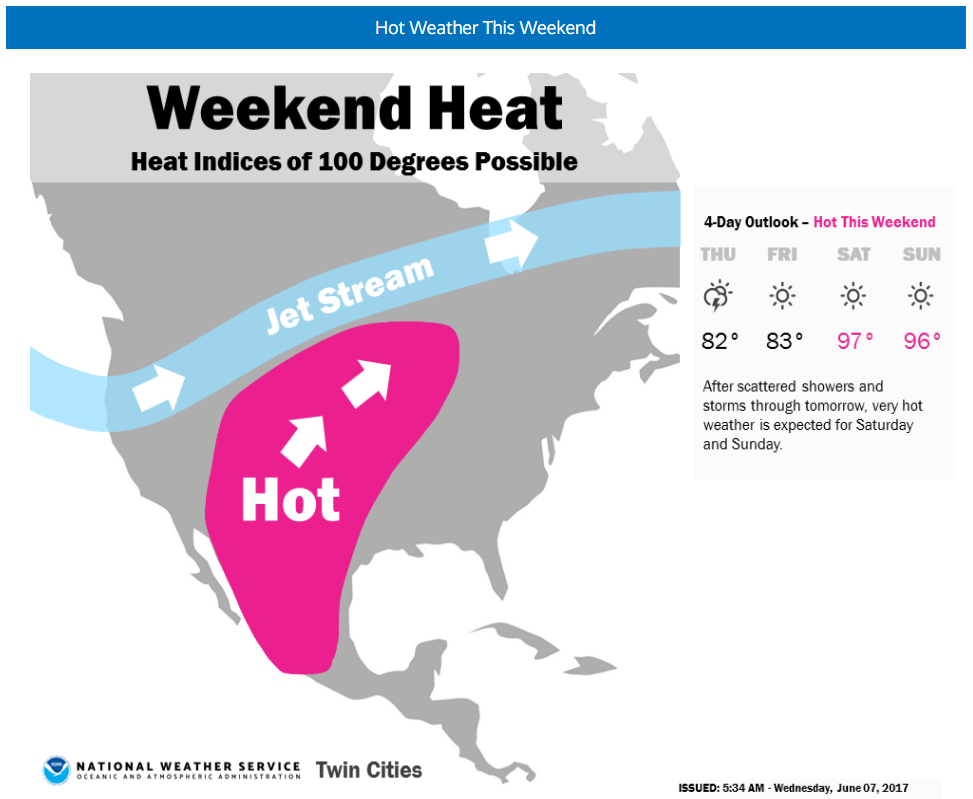
Hot Weekend Ahead!!
Last weeks 3 day stretch of 90 degree highs temperatures was just a taste of what maybe to come this weekend. Take a look at the image below from the Twin Cities National Weather Service, which describes how our stinking hot weekend will come to fruition. The jet stream or upper level winds will bubble north into Canada allowing some the hottest weather since last July to push into the region. Forecast highs at this point could warm into the mid/upper 90s with heat indices into the 100s! WHEW!!
Hot & Muggy Weekend Ahead
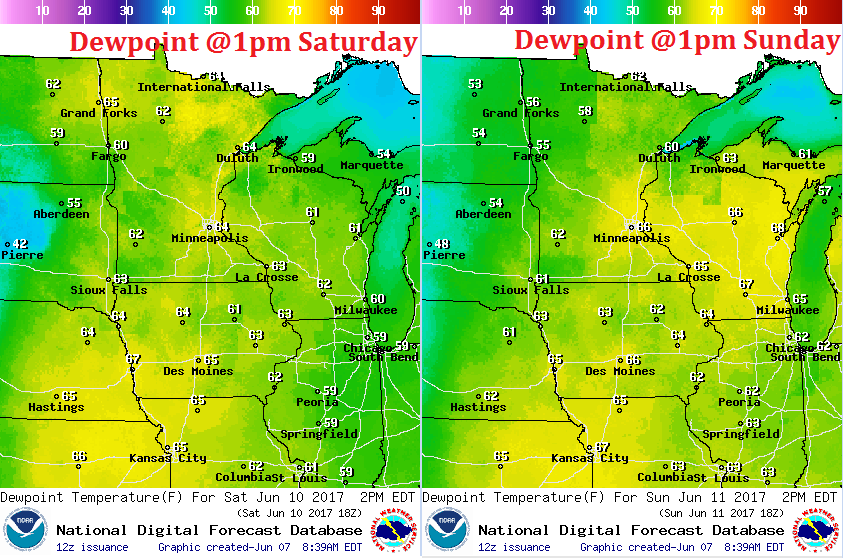
Before we get into how hot it will actually get this weekend, take a look at how high the dewpoints could get on Saturday and Sunday. With dewpoints well into the 60s it is going to get quite muggy, which will help to produce even higher heat index values. This is going to be a good weekend to stay cool, A/C if you can!
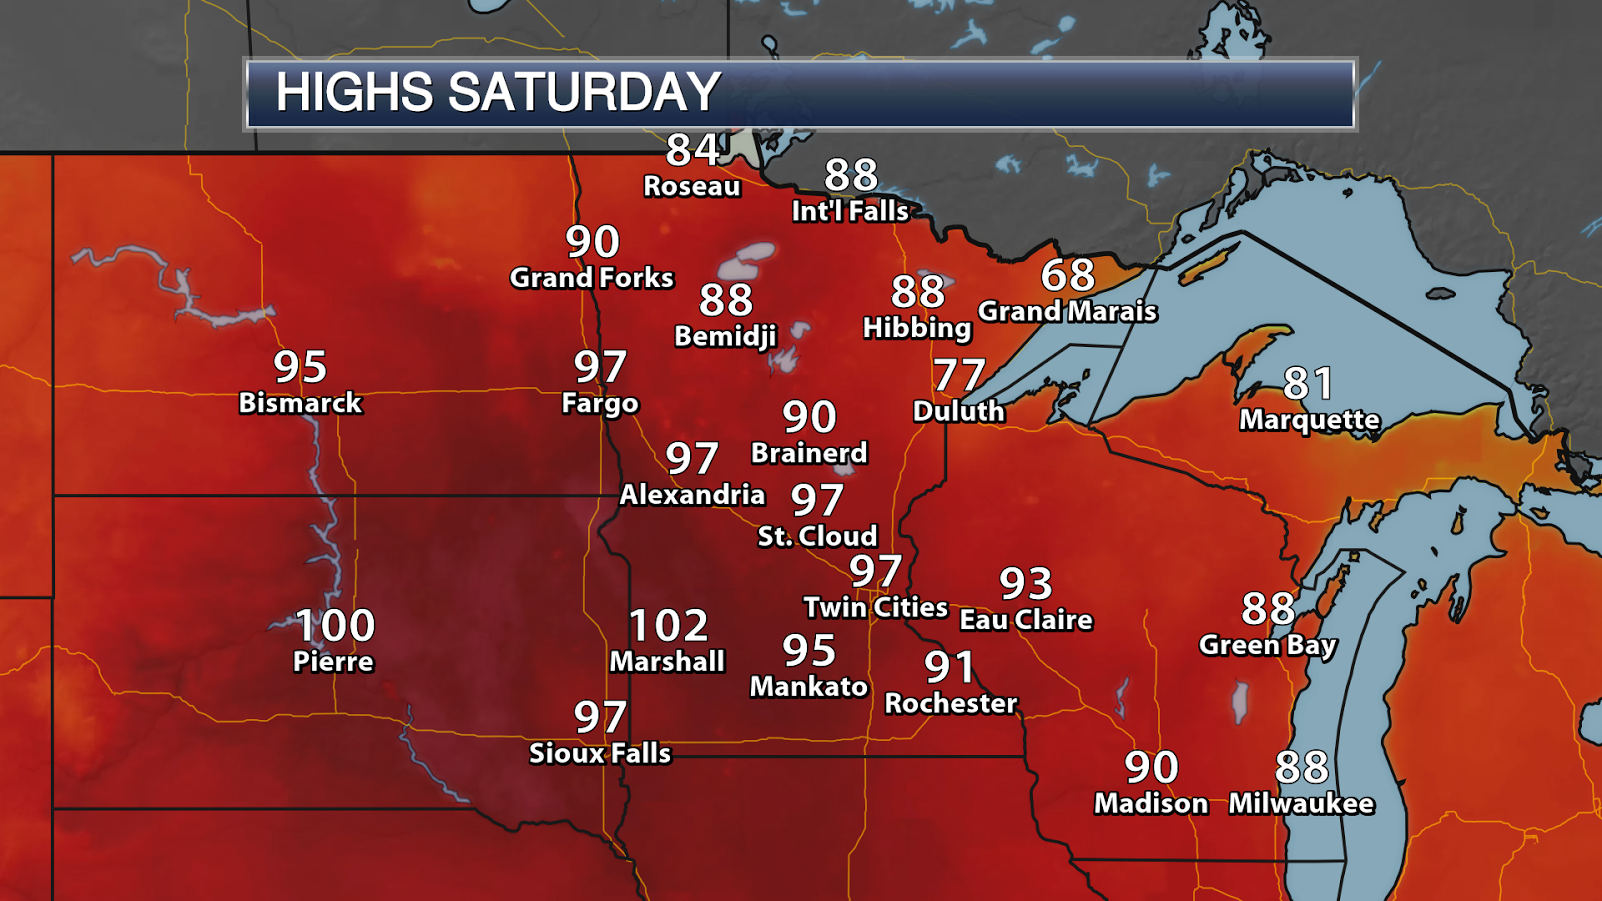
Forecast Highs Saturday
After only a week without 90s, we're back at it this weekend with highs expected to be even hotter than there were before! Take a look at how high the mercury could soar to on Saturday with many spots in the 90s and perhaps even a few low 100s showing up across far southwestern MN! While the Twin Cities may be a couple degrees away from a record high on Saturday, a few records could still fall for places like St. Cloud and Rochester! Keep in mind that with dewpoints in the 60s, heat index values will likely be in the 100s for for quite a few locations as well! It is definitely going to be steamy!

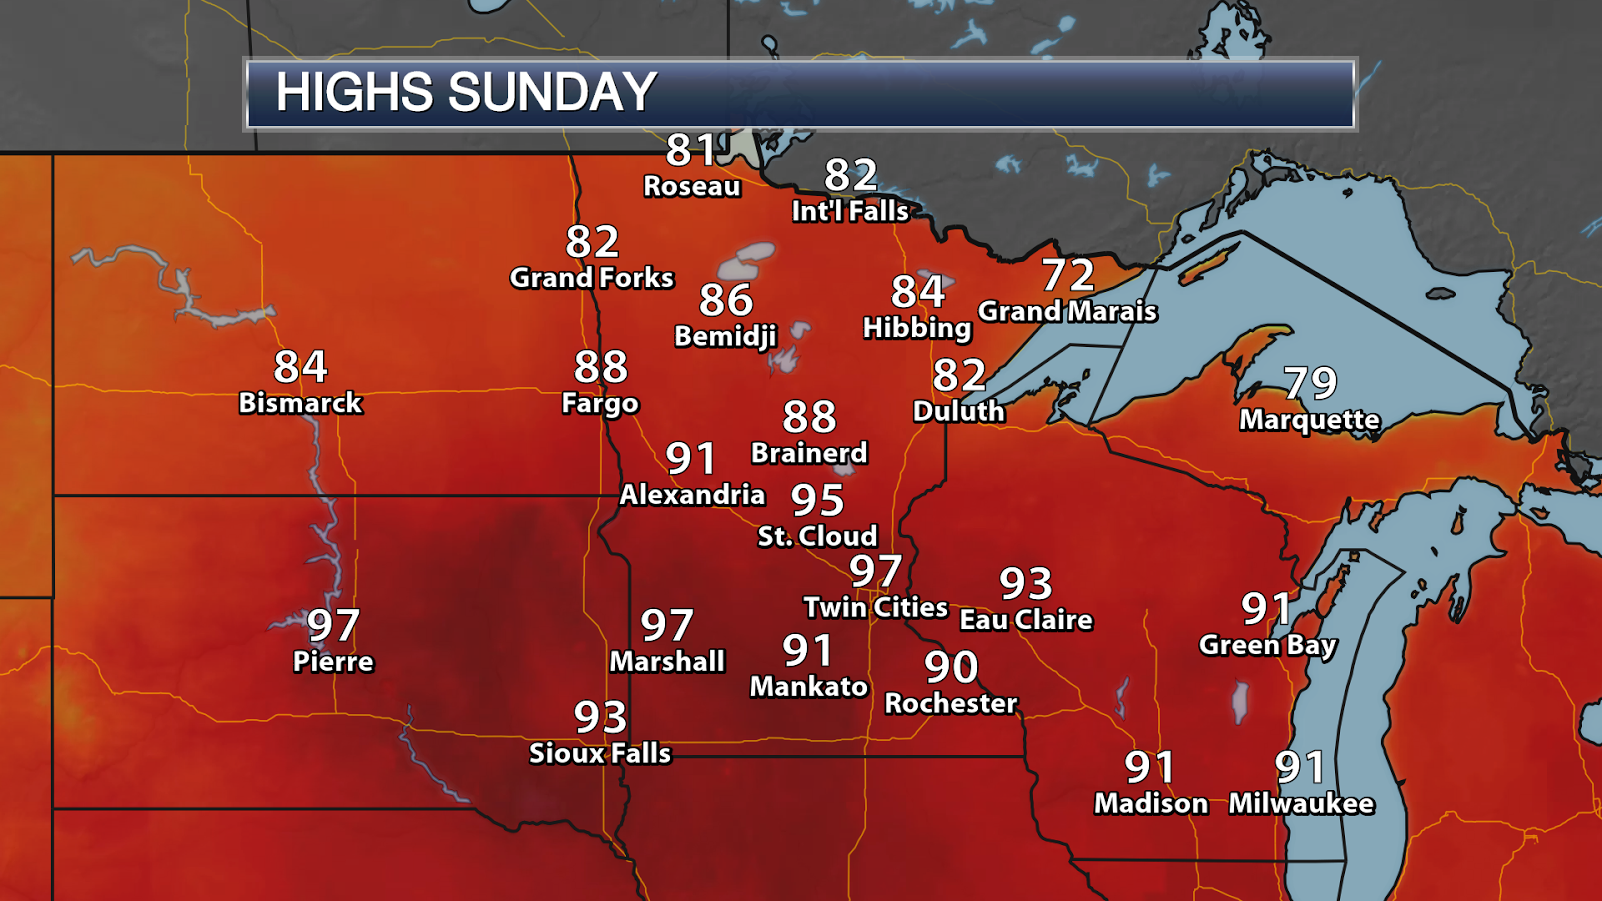
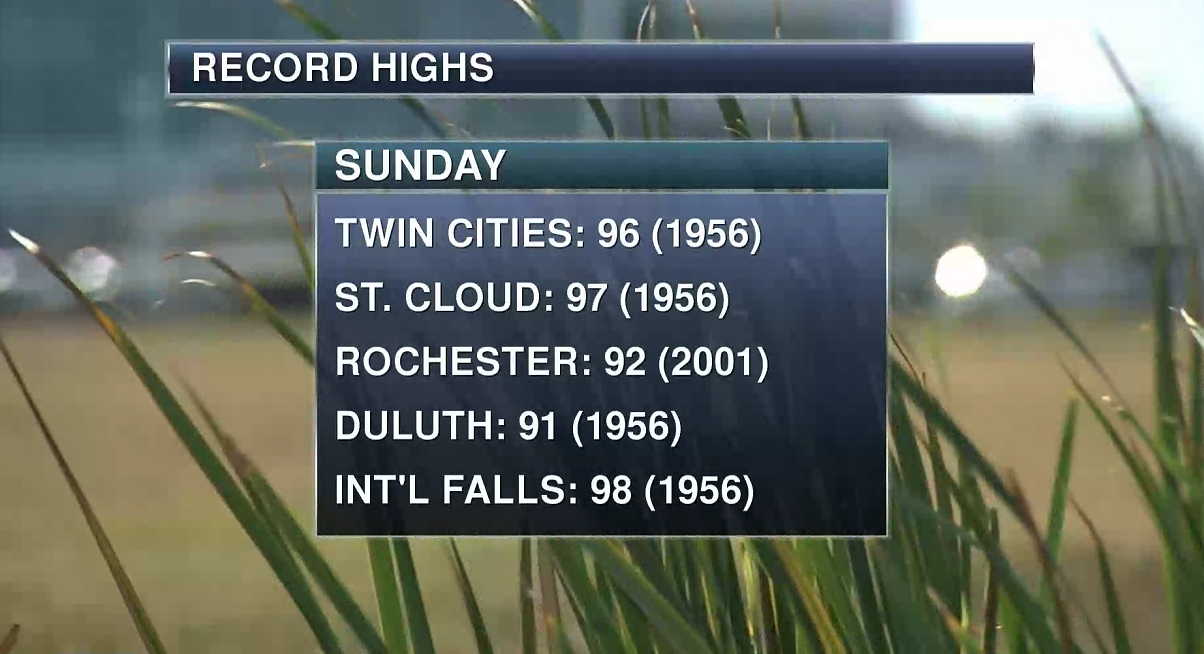
Forecast Highs on Sunday
Sunday will be another hot day day across the region with much of southern Minnesota warming into the 90s and with dewpoints in the 60s. Heat index values will like warm into the 100s with a record high even possible for the Twin Cities!
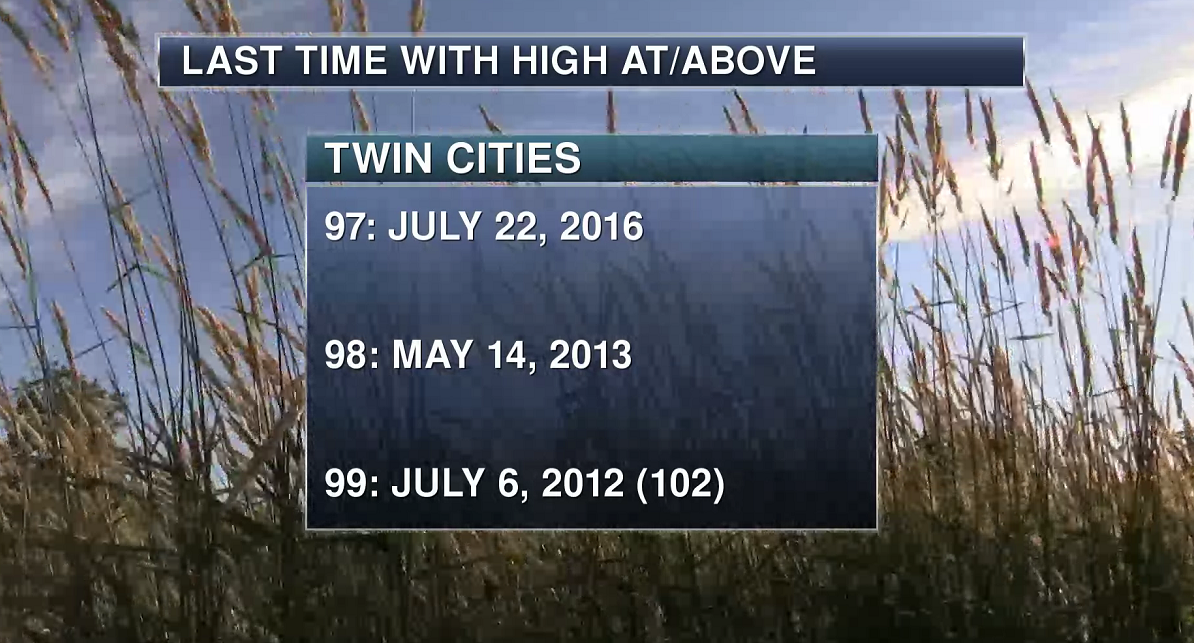
High Temperature Stats For Minneapolis
With high temperatures approaching the upper 90s this weekend, you might be interested in knowing when the last time the Twin Cities hit these particular high temperature benchmarks. Note that our warmest temperature last year was 97F set on July 22, while you have to go back to May 14, 2013 to see the last time we hit 98F and the last time we were in the 100s was back on July 6, 2012.
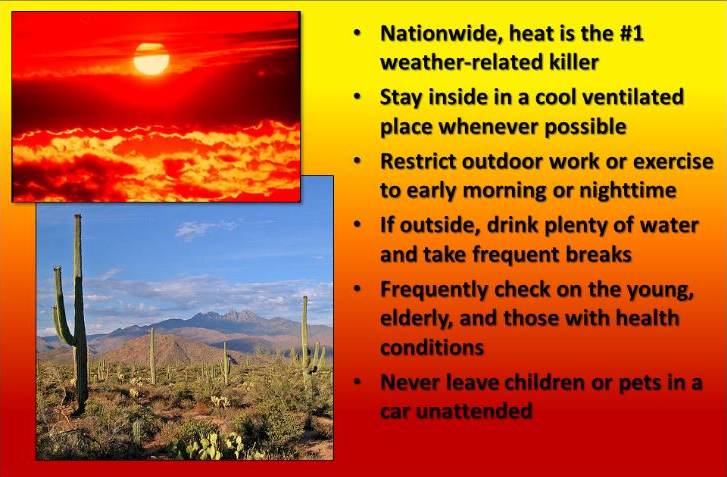
Heat is the #1 Weather Related Killer in the U.S.
Nationwide, heat is the #1 weather-related killer. Stay inside in a cool ventilated place whenever possible. Restrict outdoor work or exercise to early morning or nighttime. If outside, drink plenty of water and take frequent breaks. Frequently check on the young, elderly, and those with health conditions. Never leave children or pets in a car unattended.
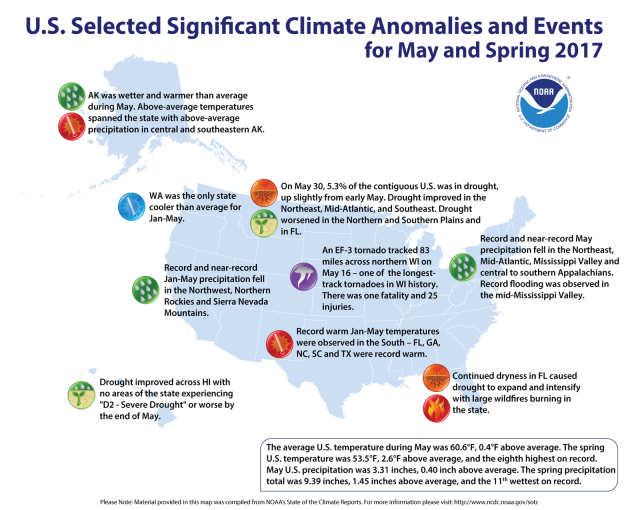
"Assessing the U.S. Climate in May 2017"
"The contiguous United States had its 8th warmest and 11th wettest spring
Courtesy of Pixabay.com The spring (March–May) average temperature for the contiguous U.S. was 53.5°F, 2.6°F above the 20th century average, driven in large part by warmth during the early and middle part of the season. Much-above-average spring temperatures were observed in the Rockies, Southern Plains, Midwest, and Southeast. The May average temperature for the contiguous U.S. was 60.6°F, 0.4°F above average, and ranked near the middle of the 123-year period of record. Parts of the West and Southeast were warmer than average with near- to below-average temperatures in parts of the central and eastern U.S. The spring precipitation total was 9.39 inches, 1.45 inches above the 20th century average. Much-above-average precipitation fell across the Northwest, Central Plains, Mid-Mississippi Valley, Great Lakes, and Mid-Atlantic. The Northern Plains, Southwest, and Florida were drier than average. The May contiguous U.S. precipitation total was 3.31 inches, 0.40 inch above average, tying 2009 as the 25th wettest on record."
Courtesy of Pixabay.com The spring (March–May) average temperature for the contiguous U.S. was 53.5°F, 2.6°F above the 20th century average, driven in large part by warmth during the early and middle part of the season. Much-above-average spring temperatures were observed in the Rockies, Southern Plains, Midwest, and Southeast. The May average temperature for the contiguous U.S. was 60.6°F, 0.4°F above average, and ranked near the middle of the 123-year period of record. Parts of the West and Southeast were warmer than average with near- to below-average temperatures in parts of the central and eastern U.S. The spring precipitation total was 9.39 inches, 1.45 inches above the 20th century average. Much-above-average precipitation fell across the Northwest, Central Plains, Mid-Mississippi Valley, Great Lakes, and Mid-Atlantic. The Northern Plains, Southwest, and Florida were drier than average. The May contiguous U.S. precipitation total was 3.31 inches, 0.40 inch above average, tying 2009 as the 25th wettest on record."
___________________________________________________________________
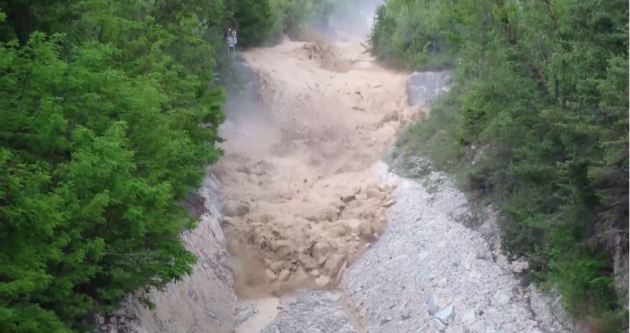
"Each year this ‘terrifying’ mudslide careens down Switzerland’s Illhorn mountain"
"Each spring, after layers of snow and ice-filled dirt melt under sun and rain, this powerful mudslide comes careening down Switzerland’s Illhorn mountain. It’s predictable only in the sense that it’s annual — other than that, there’s nothing to signal when this flood of dirt and debris will occur. Pierre Zufferey tried to capture the moment for years unsuccessfully. Last year, he was in the right place at the right time and just happened to catch one of the largest Illhorn flows in recent memory. This year he nailed it again and caught the flow on May 29. David Petley, a geologist at the University of Sheffield, calls the annual flow “terrifying,” with a “boulder-choked” onset."
See more from WashingtonPost.com HERE:
Rainfall near Illhorn Mountain in Illgraben, Switzerland triggered a gushing stream of mud and debris. (YouTube/Pierre Zufferey)
 ______________________________________________________________________
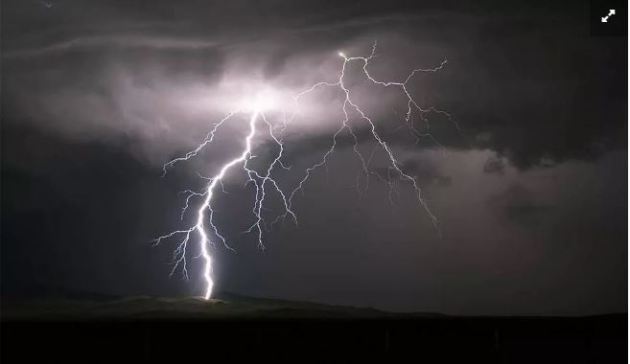
"Everything Explained: Thunderstorm Avoidance, Penetration and Survival"
______________________________________________________________________
"Everything Explained: Thunderstorm Avoidance, Penetration and Survival"
See more from WashingtonPost.com HERE:
Rainfall near Illhorn Mountain in Illgraben, Switzerland triggered a gushing stream of mud and debris. (YouTube/Pierre Zufferey)
Are you a pilot? Have you experienced flying through thunderstorms while in the cockpit? Here's a great article by FlyingMag.com on how to survive a thunderstorm while in the air!
Millions of words have been written about thunderstorms. Here’s everything you really need to know.
Inadvertent Thunderstorm Penetration and Survival:
1.) Choose the best altitude, as low as possible.
2.) Tighten seat belts and secure your flight bag (so it doesn’t hit the roof and deposit its contents onto your head).
3.) Pitot heat, prop de-ice and/or engine anti-ice: on.
4.) Cockpit lights: highest intensity. Keep your eyes on the instruments, not on the light show outside.
5.) Slow down. Establish a power setting to maintain maneuvering speed (Va), but do not chase altitude or airspeed excursions.
6.) Extending the landing gear can help to slow and stabilize the airplane.
See more from FlyingMag.com HERE:
(Avoid the anvil (downwind) side of a thunderstorm by at least 1 mile for every knot of wind at that flight level. Avoid any thunderstorm by at least 20 miles. Credit: Getty Images via FlyingMag)
 ____________________________________________________________________
2.) Tighten seat belts and secure your flight bag (so it doesn’t hit the roof and deposit its contents onto your head).
3.) Pitot heat, prop de-ice and/or engine anti-ice: on.
4.) Cockpit lights: highest intensity. Keep your eyes on the instruments, not on the light show outside.
5.) Slow down. Establish a power setting to maintain maneuvering speed (Va), but do not chase altitude or airspeed excursions.
6.) Extending the landing gear can help to slow and stabilize the airplane.
See more from FlyingMag.com HERE:
(Avoid the anvil (downwind) side of a thunderstorm by at least 1 mile for every knot of wind at that flight level. Avoid any thunderstorm by at least 20 miles. Credit: Getty Images via FlyingMag)
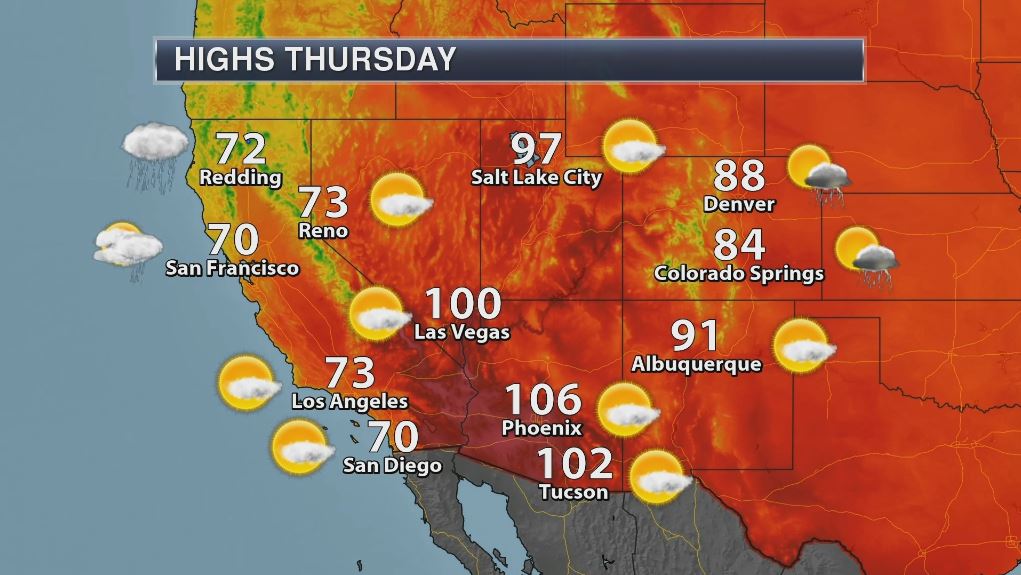
Heat Slowly Fading in the Southwest - High Temperatures on Thursday
Even though Excessive Heat Warnings have been allowed to expire across parts of the Desert Southwest, it is still going to be hot in spots. Take a look at the forecast highs for Thursday across the region and note that Tucson, Phoenix and Las Vegas will still be in the 100s, while Salt Lake City, UT will be very close to the century mark once again!
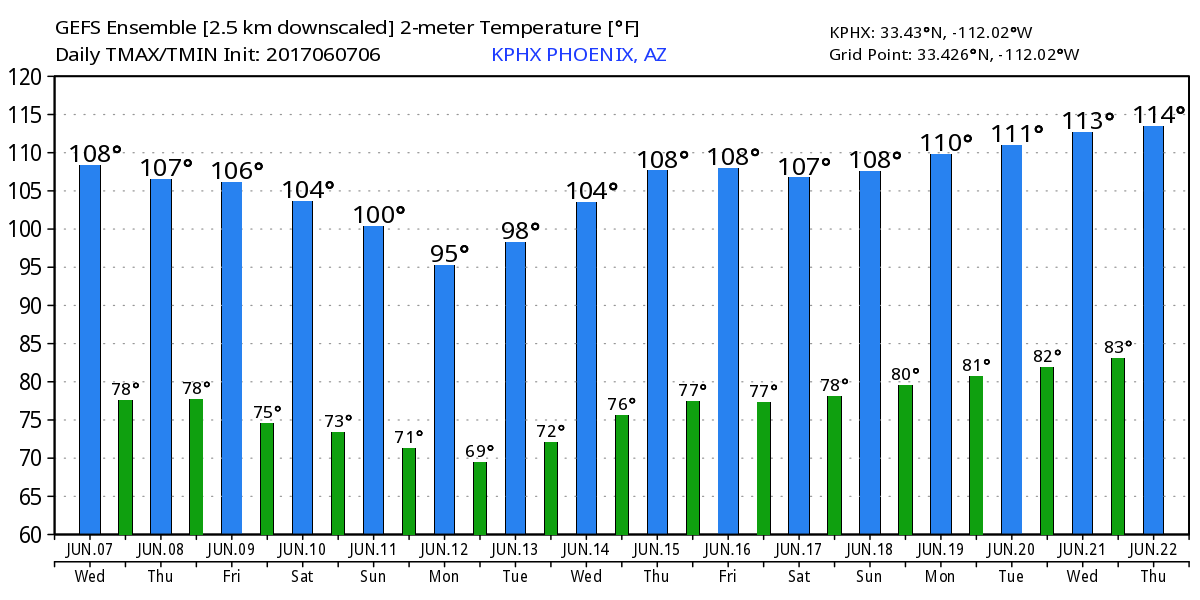
Extended Forecast For Pheonix, AZ
While Excessive Heat Warnings have been allowed to expire across the Desert Southwest, it is still going to be quite hot through the weekend. By early next week, temperatures will dip into the 90s, but the extended forecast suggests another round of very hot weather possibly moving back in by the second half of the month! Good grief!
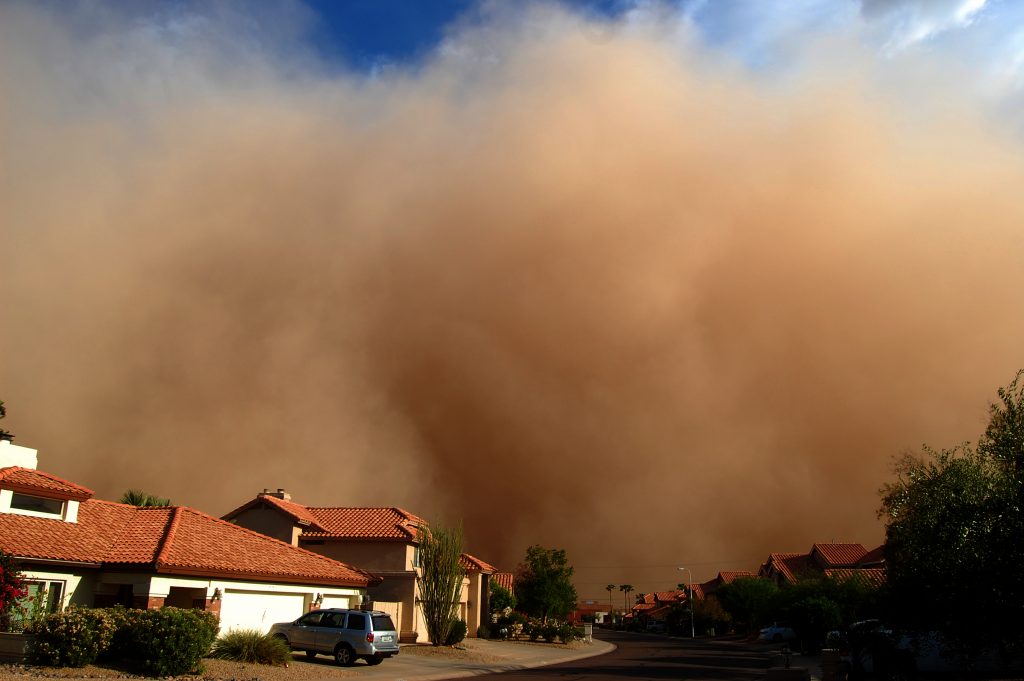
"Why more dust storms and Valley fever are blanketing the Southwest"
"Giant dust storms are sweeping the southwestern United States more frequently. Why? Rising sea temperatures, according to a study published in the journal of Geophysical Research Letters. The study also links the rise in dust storms with an 800 percent increase in cases of Valley fever, a rare fungal lung infection. This cascade of events “could be just a part of a natural variation and nothing to be afraid of, but it also could be something bigger and more permanent,” said Daniel Tong, an atmospheric scientist at George Mason University who led the project. To draw these connections, Tong’s team developed a new way to analyze dust. They relied on the IMPROVE network of air quality monitoring sites, instituted by the Clean Air Act. These scientific sites were originally developed to monitor aerosols and visibility in national parks by collecting information about air particles, including their size, concentration and chemical composition. The team pulled measurements from 29 of the nation’s 187 sites; for the sake of consistency, they focused on the sites that had collected data for the longest period of time."
(Dust storm covers Chandler, Arizona on August 11, 2011. A new study shows an uptick in Southwestern dust storms spurred by rising sea temperatures. Photo by NOAA/NWS/Christopher Scragg)
_________________________________________________________________
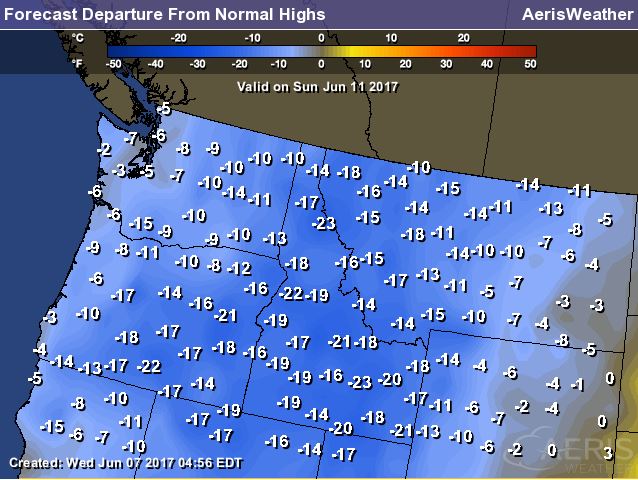
Western Storm System Will Bring Rain, Mountain Snow & Cooler Temps
The forecast from Thursday to Wednesday of next week shows a fairly large area of low pressure working into the Western US with widely scattered showers and mountain snow. This particular storm will also drop temperatures to values that will be 10F to nearly 20F below average for early/mid June.
Western Snowfall Potential
With temperatures dropping across the Western US over the weekend and into early next week, it appears that readings will be cold enough for snow to develop in the Mountains! While it's still a little too early to tell how much will fall, early indications are that some of the highest elevations could see at 6" with some 12"+ tallies not out of the question.
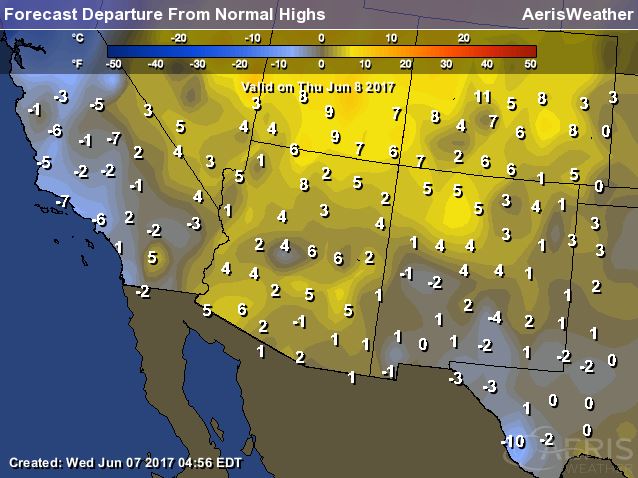
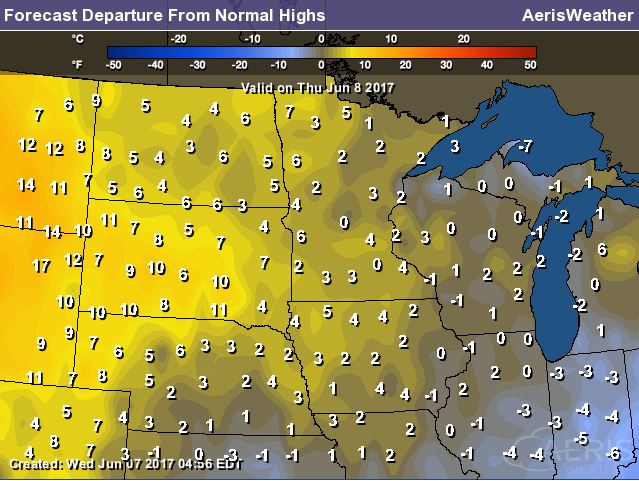
High Temperatures from Average Saturday
As the storm system moves inland, temperatures will begin to drop pretty dramatically with some locations this weekend and especially on Sunday dipping to nearly 25F below average!
_______________________________________________________________
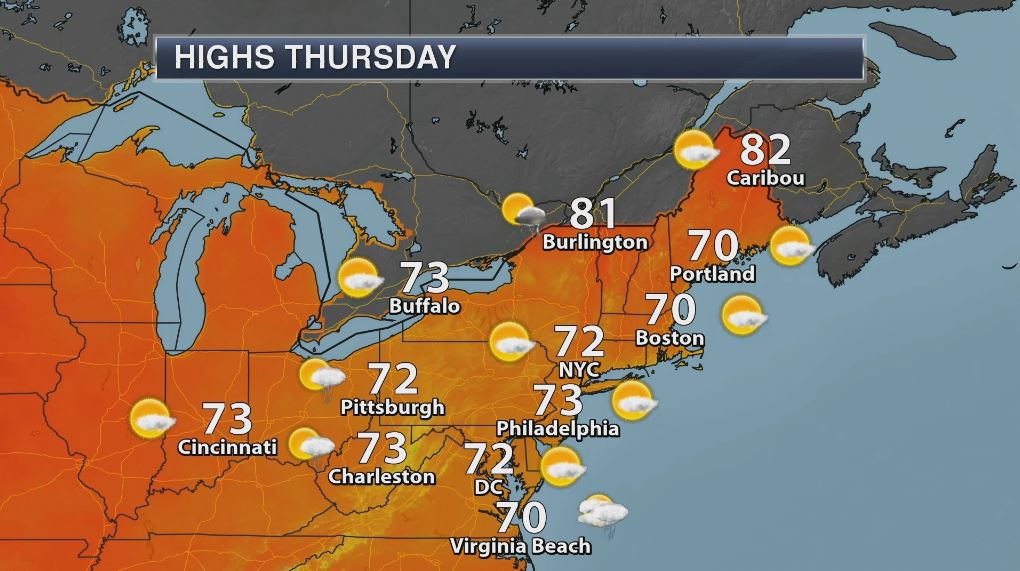
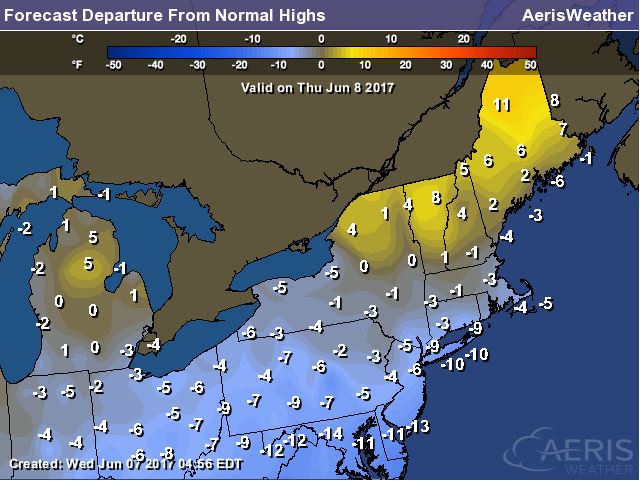
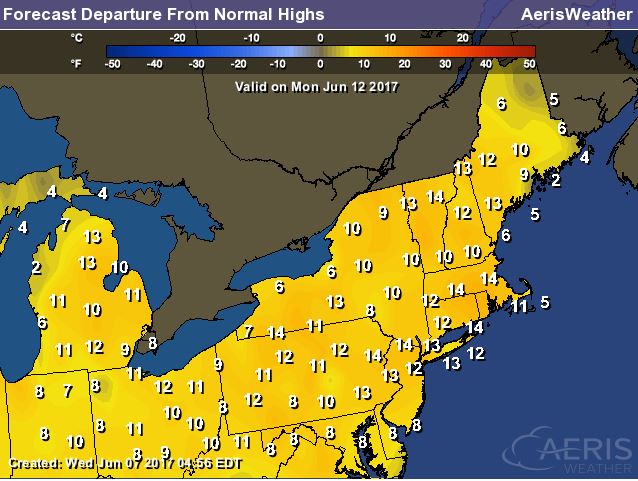
Chilly Weather in the Northeast
After VERY chilly weather in the Northeast over the last several days, temperatures on now starting to warm. Sure it'll still be a bit cool on Thursday, but summerlike heat will bubble up by the weekend! Here's a look high temperatures across the region on Thursday, which still shows some locations from Boston to New York City to Washington DC as much as 5F to nearly 15F below average.
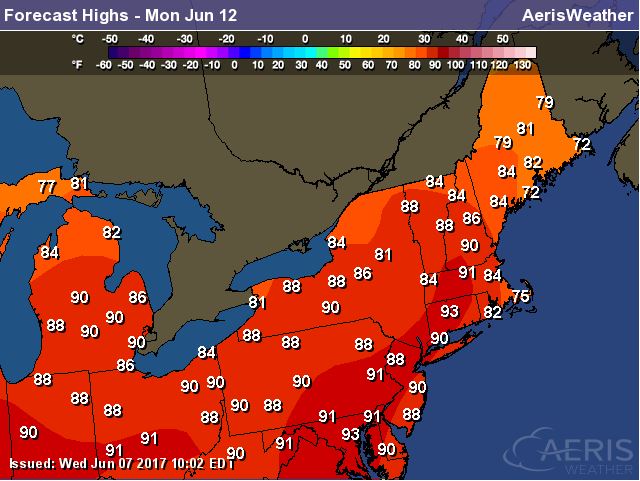
Warmer Outlook Ahead in the Northeast!
There's a big turnaround expected for the Northeast with temperatures likely warming into the 80s and 90s across much of the area. After spending several days with well below average temperatures, this is going to feel quite warm to many! By Monday highs will be nearly 10F to 15F above average!
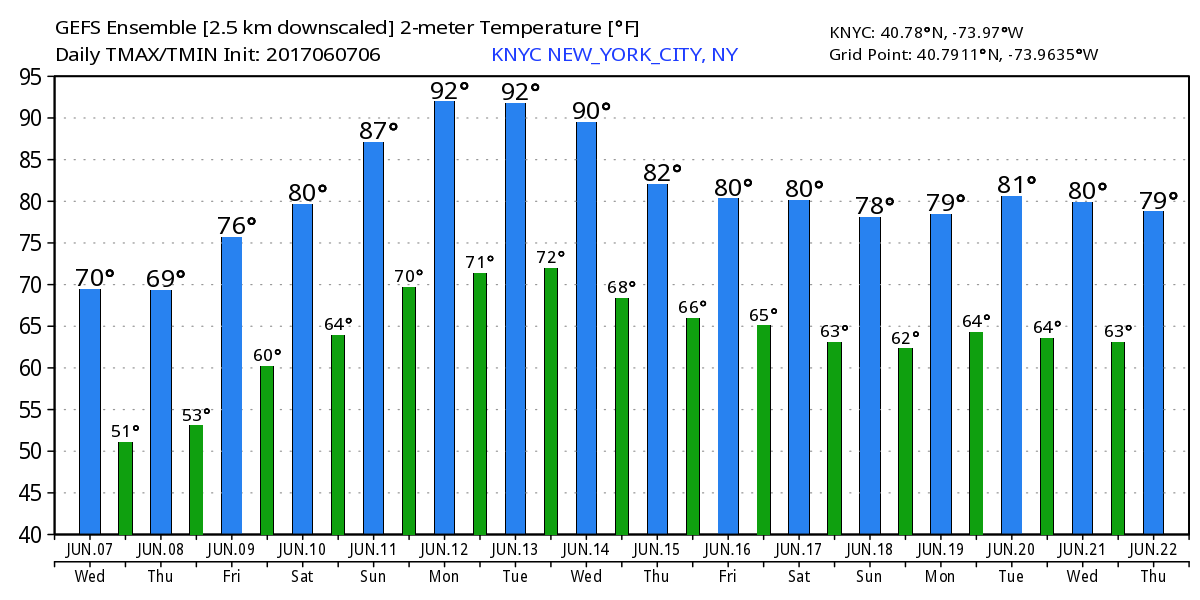
New York City Temperature Outlook
The New York City temperature forecast suggests temperatures finally warming up a bit by the end of the week and weekend ahead. In fact, temperatures early next week could warm into the low 90s before leveling off to more normal readings later in the week.
_______________________________________________________________
Warmer Outlook Ahead in the Northeast!
There's a big turnaround expected for the Northeast with temperatures likely warming into the 80s and 90s across much of the area. After spending several days with well below average temperatures, this is going to feel quite warm to many! By Monday highs will be nearly 10F to 15F above average!
New York City Temperature Outlook
The New York City temperature forecast suggests temperatures finally warming up a bit by the end of the week and weekend ahead. In fact, temperatures early next week could warm into the low 90s before leveling off to more normal readings later in the week.
_______________________________________________________________
Weather Outlook
A storm system in the Southeastern US will continue to kick out scattered showers and storms across parts of Florida and the Mid-Atlantic states through Thursday before heavy rains and spotty strong storms fade. Meanwhile, a new storm system will move into the Western US with scattered rain showers and perhaps even a few mountain snow showers through early next week.
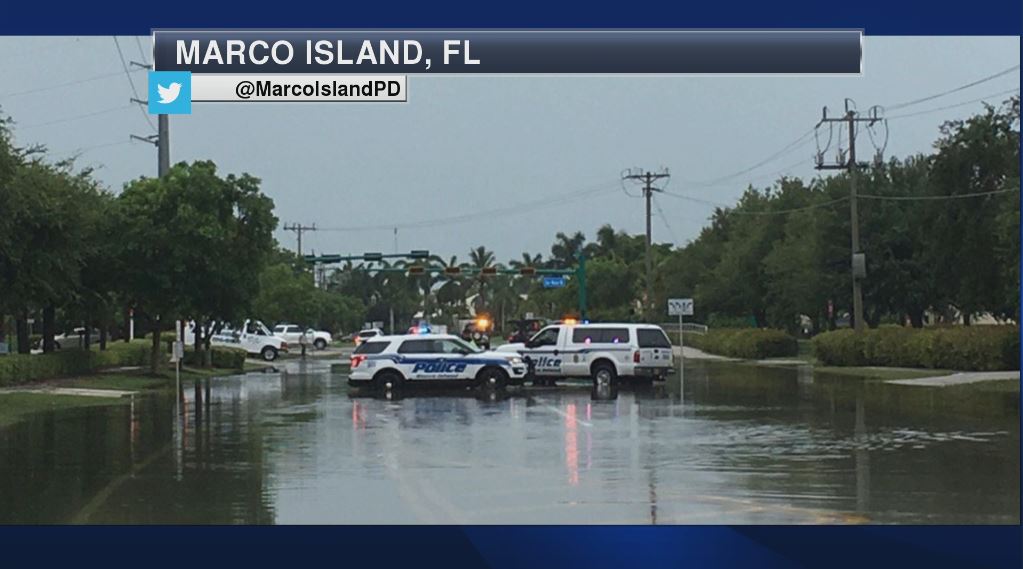
Florida Flooding
This has been a wet week already across parts of Florida, especially in Marco Island where heavy rainfall lead to flooding. Here's a picture from @MarcoIslandPD that shows flooded a closed streets from earlier this week.
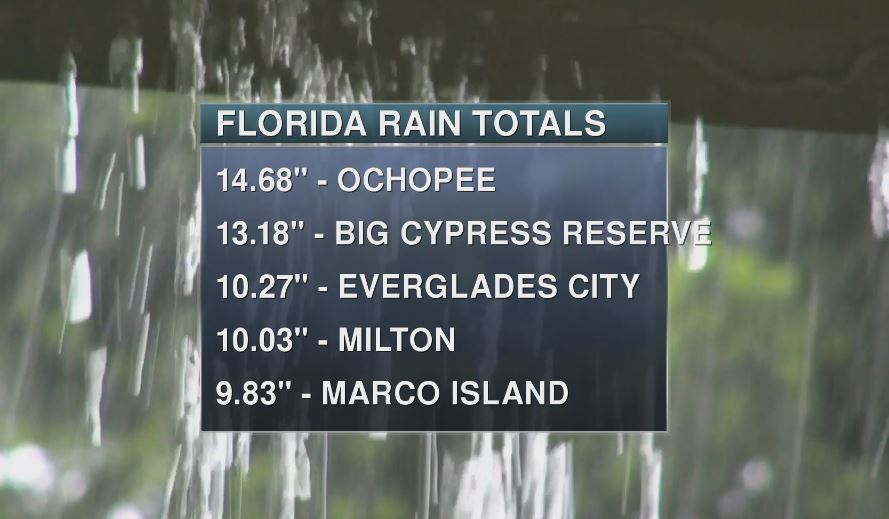
Heavy Rains Past Few Days
WOW! Take a look at some of these rainfall tallies that parts of Florida has seen over the past few days. Some locations have seen more than 12" since earlier this week! Talk about drought denting rains...

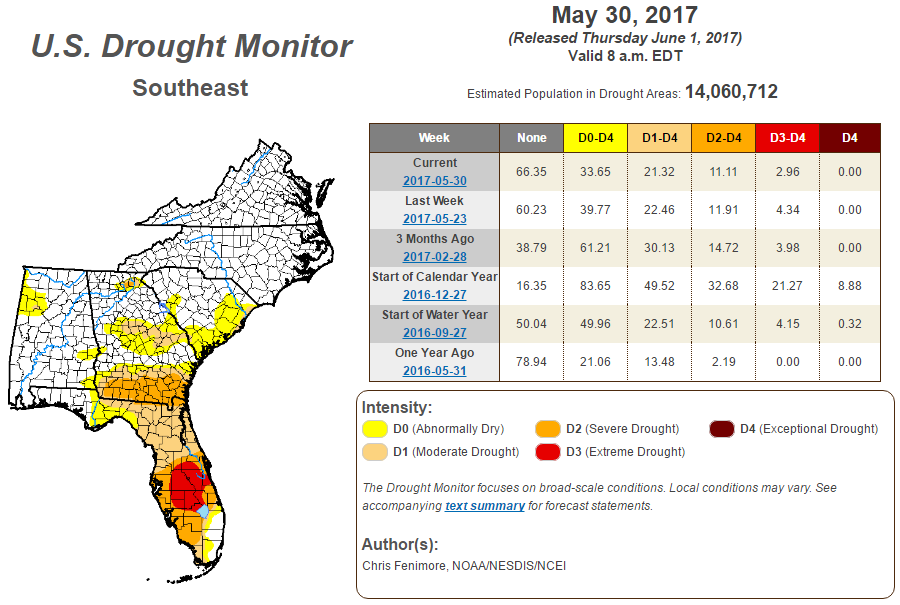
Drought in the Southeast
According to the US Drought Monitor, parts of Florida are still in an Extreme Drought. There has a little improvement since last week, but the more noticeable improvement has been since the beginning of the year, when nearly 21% of the Southeast was considered in an Extreme Drought and nearly 9% was in Exceptional Drought.
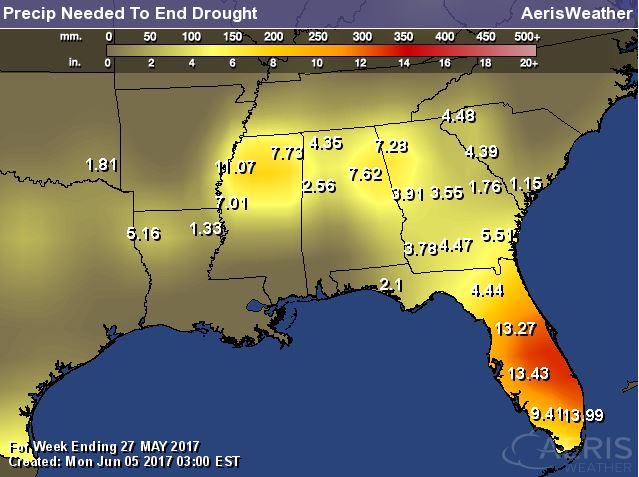
Precipitation Needed to End Drought
Here's a look at how much rainfall is needed to end the drought in the Southeast. Note that some locations across central and southern Florida will need nearly a foot of rain to end the very dry conditions there.
Heavy Rain Fades in the Southeast
Widely scattered showers and thunderstorms will continues across parts of the Southern Florida through the end of the week, however, much of the excessive rainfall has moved out of the region. With that said, there still maybe pockets of locally heavy rainfall with the threat of tropical downpours continuing there.
.gif)
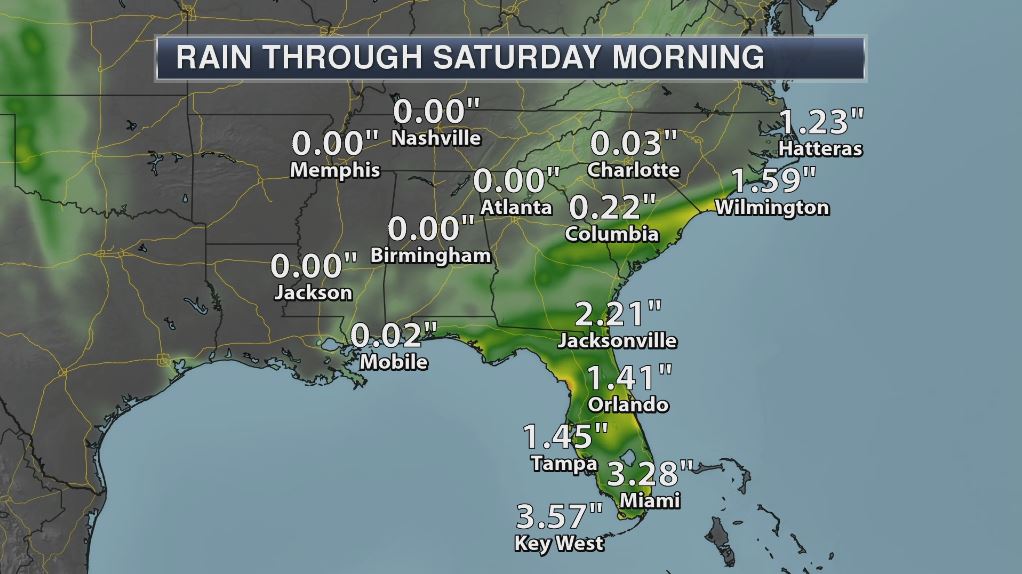
Rainfall Potential Through AM Friday
The rainfall potential across through Southeast looks fairly impressive through Saturday morning. Note that several locations could still see 1" to 2" while a few locations across southern Florida could see up to 3" to 5"!
_________________________________________________________________
PRELIMINARY 2017 Tornado Count
According to NOAA's SPC, the PRELIMINARY 2017 tornado count is 953 (through June 6). Note that is the most active year for tornadoes since 2011, when there were nearly 1,400 tornadoes. Keep in mind there was a major tornado outbreak in the Gulf Coast region from April 25-28, 2011 that spawned nearly 500 tornadoes, some of which were deadly. That outbreak is known as the Super Outbreak of 2011 and has gone down in history as one of the biggest, costliest and one of the deadliest tornado outbreaks in history.
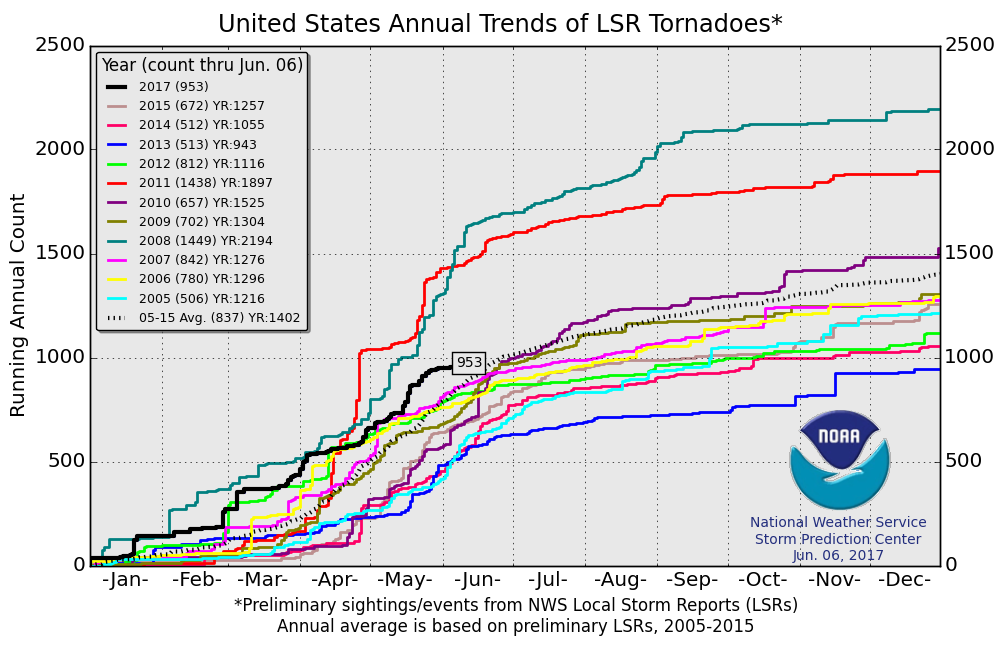 According to NOAA's NCDC, June is the 2nd busiest month for tornadoes behind May across the country, averaging 243! Note that most of these tornadoes occur across the Plains from Texas to Nebraska, which is also in a region known as "Tornado Alley". As it stands now, May was the busiest tornado month of the year thus far with a preliminary total of 278.
___________________________________________________________________
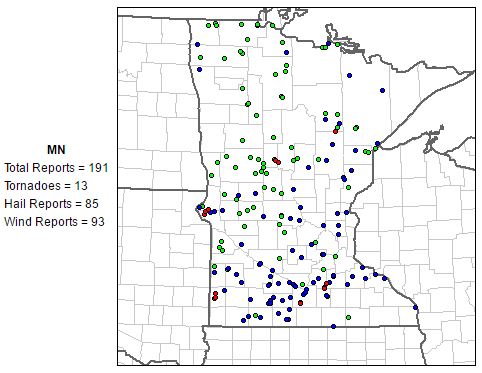
Minnesota Tornadoes in 2016
While June is typically the busiest month of the year for tornadoes in the state of Minnesota (averaging 18), there were only 13 tornadoes in June last year. However, there were nearly 200 severe weather reports.
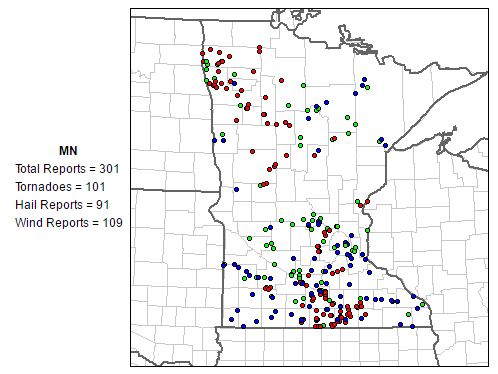
Severe Weather Reports in 2010
The last time June had an above average tornado month was in 2010 when there were nearly 100 tornadoes reported. On June 17th, there were three EF-4 tornadoes and four EF-3 tornadoes, 3 of which were deadly!
________________________________________________________________________
Weekend Outlook: Seriously Hot and Sweaty
By Paul Douglas
Most of us gripe about the cold 6 months out of the year so I'm not about to complain about the heat. Although by Saturday afternoon "go jump in a lake!" will be helpful advice.
On a scale from uncomfortably hot to "stinking hot" to extreme, potentially dangerous heat, Saturday may fall into the danger-zone. Both NOAA and ECMWF (European) models pull a surge of desert heat into Minnesota by Saturday. Picture Phoenix heat and dew points more typical of Orlando; possibly 70F or higher. Air temperatures may surge into the upper 90s with a Heat Index ranging from 100-110F.
Don't even think about leaving a child (or pet) in a vehicle; fatal heat stroke may set in within a few minutes under such conditions.
Sunday looks just as humid but T-storms may cool us down a few degrees. I see hot, sticky weather into much of next week, although the most oppressive heat stays just south of Minnesota.
Records may fall this weekend, but this isn't necessarily a sign of a sizzling summer to come. Occasional outbreaks of free air conditioning will spill into the northern USA. Thanks Canada.
_______________________________________________________
Average Tornadoes in June
___________________________________________________________________
Minnesota Tornadoes in 2016
While June is typically the busiest month of the year for tornadoes in the state of Minnesota (averaging 18), there were only 13 tornadoes in June last year. However, there were nearly 200 severe weather reports.
Severe Weather Reports in 2010
The last time June had an above average tornado month was in 2010 when there were nearly 100 tornadoes reported. On June 17th, there were three EF-4 tornadoes and four EF-3 tornadoes, 3 of which were deadly!
________________________________________________________________________
Weekend Outlook: Seriously Hot and Sweaty
By Paul Douglas
Most of us gripe about the cold 6 months out of the year so I'm not about to complain about the heat. Although by Saturday afternoon "go jump in a lake!" will be helpful advice.
On a scale from uncomfortably hot to "stinking hot" to extreme, potentially dangerous heat, Saturday may fall into the danger-zone. Both NOAA and ECMWF (European) models pull a surge of desert heat into Minnesota by Saturday. Picture Phoenix heat and dew points more typical of Orlando; possibly 70F or higher. Air temperatures may surge into the upper 90s with a Heat Index ranging from 100-110F.
Don't even think about leaving a child (or pet) in a vehicle; fatal heat stroke may set in within a few minutes under such conditions.
Sunday looks just as humid but T-storms may cool us down a few degrees. I see hot, sticky weather into much of next week, although the most oppressive heat stays just south of Minnesota.
Records may fall this weekend, but this isn't necessarily a sign of a sizzling summer to come. Occasional outbreaks of free air conditioning will spill into the northern USA. Thanks Canada.
_______________________________________________________
Extended Forecast
THURSDAY: Partly sunny and breezy. Winds: W 5-10 High: 84.
THURSDAY NIGHT: Partly cloudy and quiet. Winds: N 5. Low: 60
FRIDAY: Plenty of sticky sunshine. Winds: SE 5-10. High: 85.
SATURDAY: Sunny. Dangerously hot. Heat Index: 105+. Winds: SW 15-25. Wake-up: 60. High: 90.
SUNDAY: Still steamy, few t-storms around. Winds: SE 8-13. Wake-up: 73. High: 91.
MONDAY: Another heat spike. Few t-storms around. Winds: S 10-15. Wake-up: 72. High: 93.
TUESDAY: Dog days of June. Late day storm? Winds: S 10-15. Wake-up: 73. High: 92.
WEDNESDAY: Still unsettled. Another T-storm. Winds: W 10-15. Wake-up: 70. High: 89.
_______________________________________________________
_______________________________________________________
This Day in Weather History
June 8th
June 8th
1972: 8 inches of rain falls in 7 hours at Madelia Township in Wantonwan County.
1893: Violent winds occur at Maple Plain from 1:30 to 2:15pm. A large frame house was moved 8 feet from its foundation. Many barns and haysheds blown over by the wind. One barn was blown across Dutch Lake.
________________________________________________________
________________________________________________________
Average High/Low for Minneapolis
June 8th
June 8th
Average High: 77F (Record: 102F set in 1985)
Average Low: 56F (Record: 36F set in 1885)
Average Low: 56F (Record: 36F set in 1885)
Record Rainfall: 2.12" set in 1919
_________________________________________________________
_________________________________________________________
Sunrise/Sunset Times for Minneapolis
June 8th
June 8th
Sunrise: 5:27am
Sunset: 8:57pm
Sunset: 8:57pm
Hours of Daylight: 15hours & 31mins
Daylight gained since yesterday: ~56seconds
Daylight gained since winter solstice (December 21st): ~6hours & 42mins
Additional Daylight Gained By Summer Solstice (June 20th): ~ 6mins
__________________________________________________________
Daylight gained since winter solstice (December 21st): ~6hours & 42mins
Additional Daylight Gained By Summer Solstice (June 20th): ~ 6mins
__________________________________________________________
Moon Phase for June 7th at Midnight
1.3 Days Before Full "Strawberry" Moon
1.3 Days Before Full "Strawberry" Moon
"June 9, 9:10 a.m. EDT – Full Strawberry Moon. Strawberry picking season peaks during this month. Europeans called this the Rose Moon. Since the moon arrives at apogee about 15 hours earlier, this will also be the smallest full moon of 2017. In terms of apparent size, it will appear 12.2 percent smaller than the full moon of Dec. 3."
_____________________________________________________________
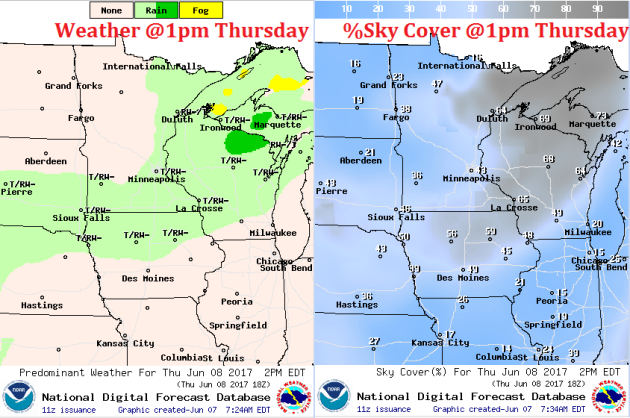
Weather Outlook for Thursday
Winds will generally be light across the region on Thursday, but will begin turning out of the NNW later in the days as our weak storm system slides east.
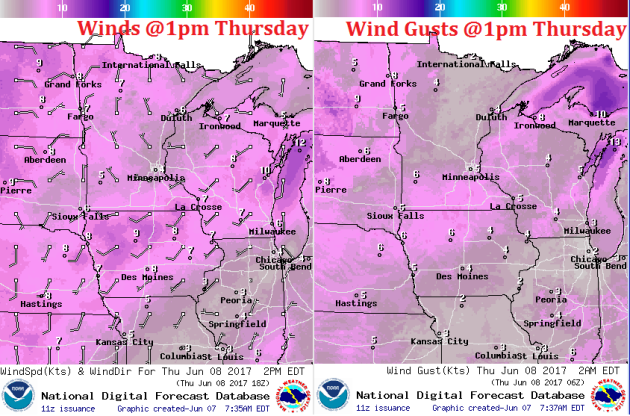
As the weak storm system slides east across the region, a few lingering showers and thunderstorms could still be possible. However, the best rain chance moves into Wisconsin and Southern Minnesota as we heat through the day. Skies will also begin clearing more through the day with sunnier conditions expected by Friday.
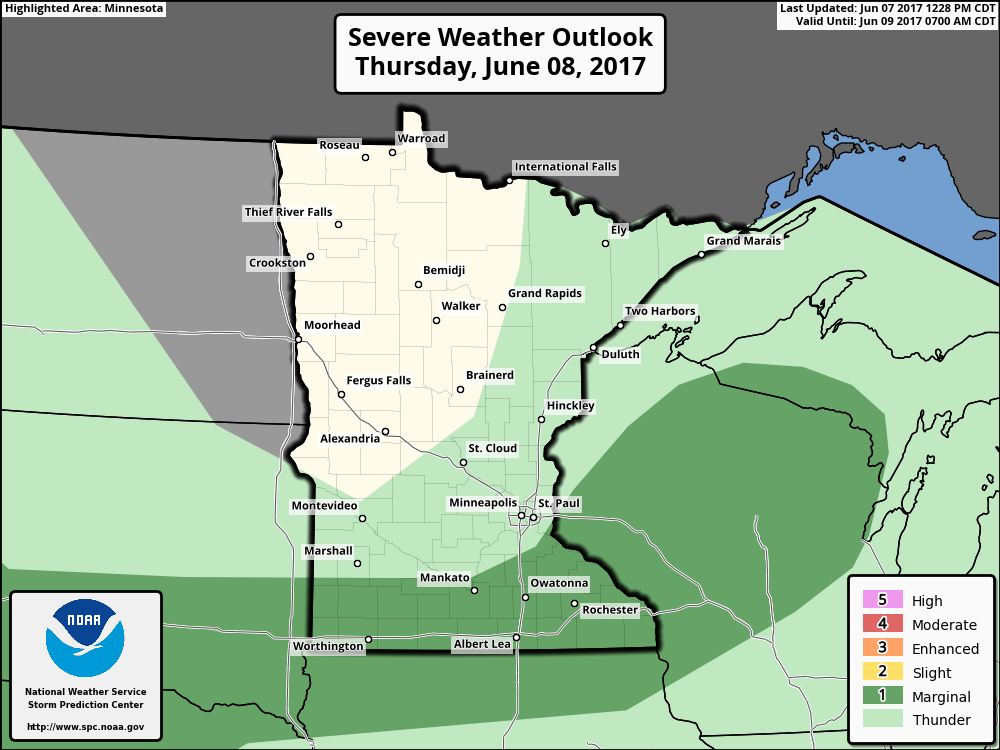
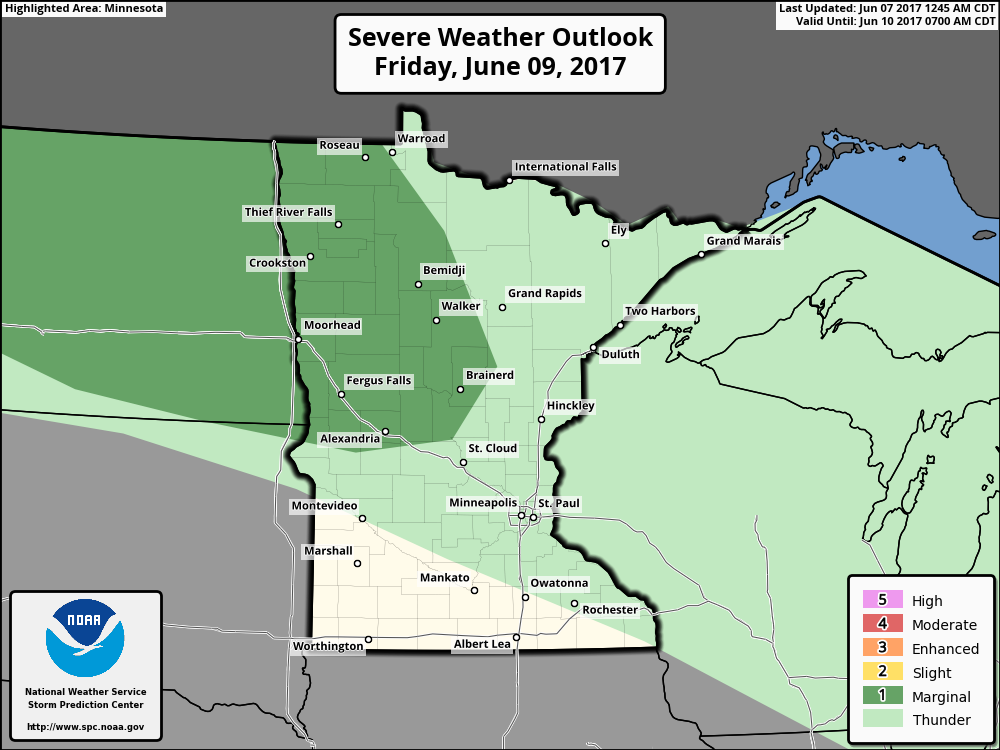
Here are the severe weather concerns over the next couple of days as issued by the Storm Prediction Center. A few storms across far southern Minnesota could pop late Thursday, but at this point, storms are expected to stay below severe limits. The front will then lift north as a warm front on Friday and could produce more late days storms, which could once again be a little on the strong side.
______________________________________________________________________
Spotty Rumbles - Isolated Strong Storms Possible
Here's the weather outlook from Thursday to Friday night which shows a few storms across far southern MN on Thursday with locally heavy downpours. Then late Friday a few strong storms could pop across far northwestern MN.
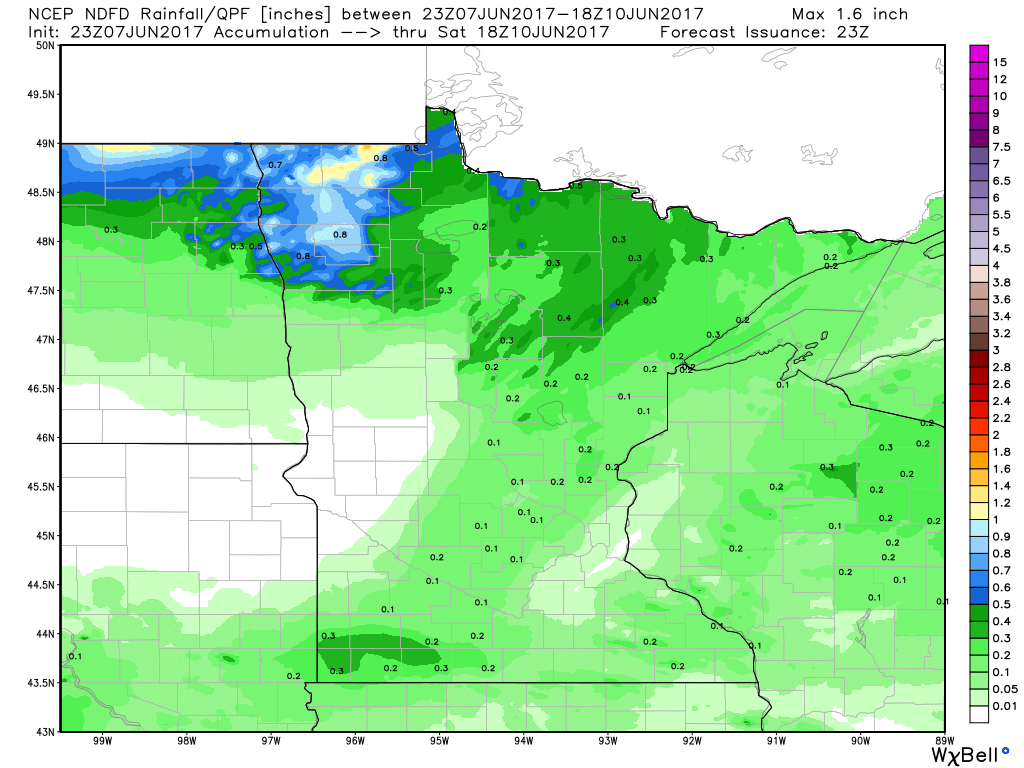
Extended Rainfall Forecast
Here's the extended rainfall forecast through midday Saturday. Scattered showers and storms will linger across parts of southern Minnesota on Thursday with another round of storms developing across northern Minnesota late Friday in Saturday with locally heavy downpours there.
______________________________________________________________________
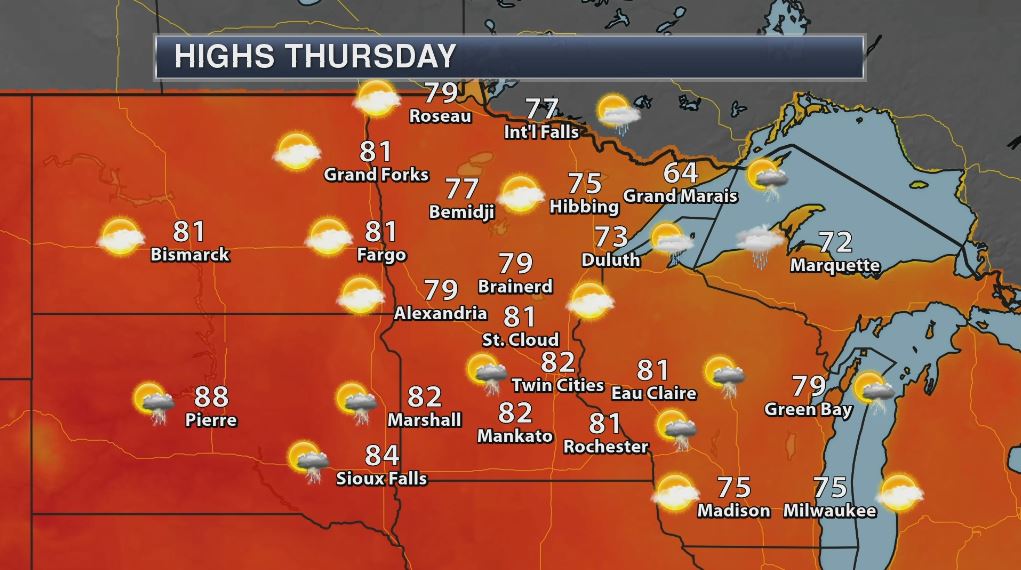
Weather Outlook for Thursday
There maybe a few lingering T-showers across the region on Thursday, but temperatures will have no problem rebounding back into the upper 70s and low 80s, which will be slightly above average for early June. The cool spot will still be found in far northeastern Minnesota, where 60s will be likely in Grand Marais. Thanks to Lake Superior, free air conditioning will be found along the North Shore.
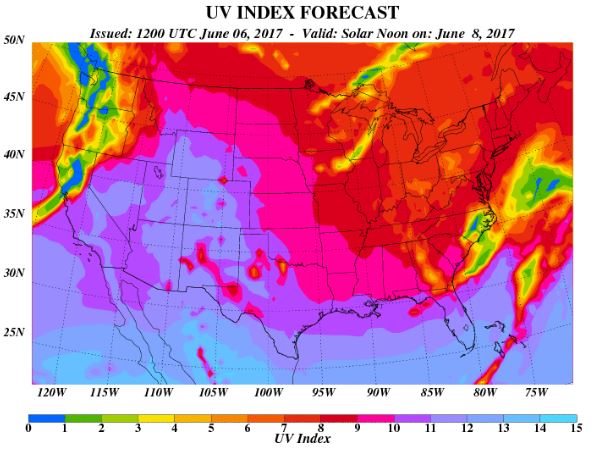
UV Index for Thursday - VERY HIGH
The UV Index will be considered VERY HIGH across much of the state of Minnesota on Thursday, which means that it will only 15 to 20 minutes or less to burn unprotected skin. With that said, if you are planning on spending any extended length of time outside, make sure you wear appropriate attire and lather on the sun block!
_____________________________________________________________________________
_____________________________________________________________________________
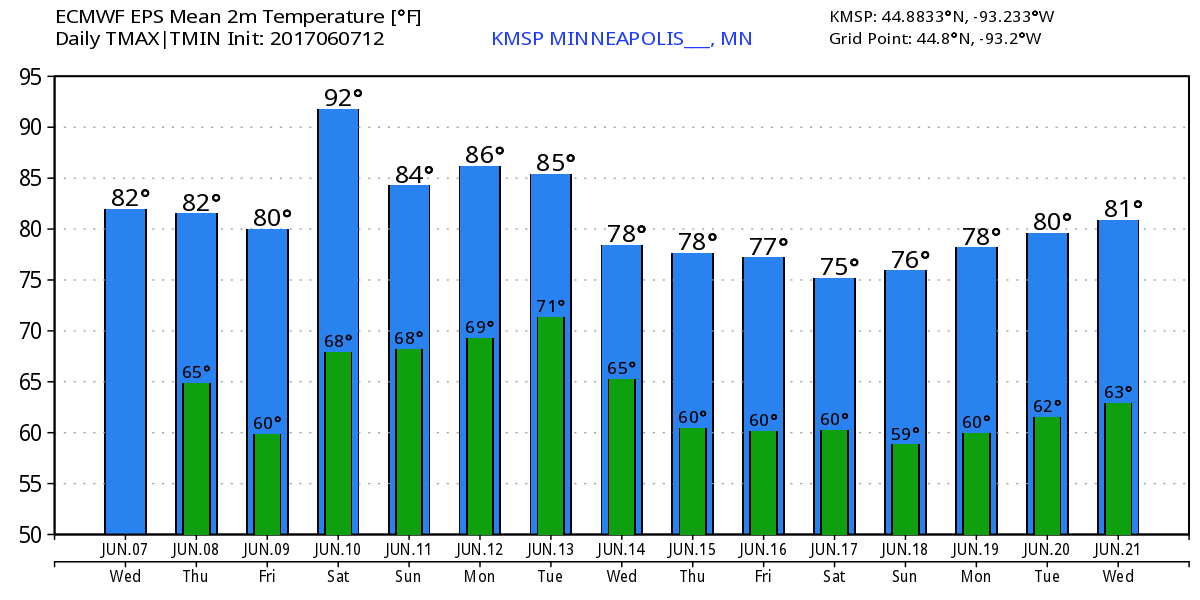
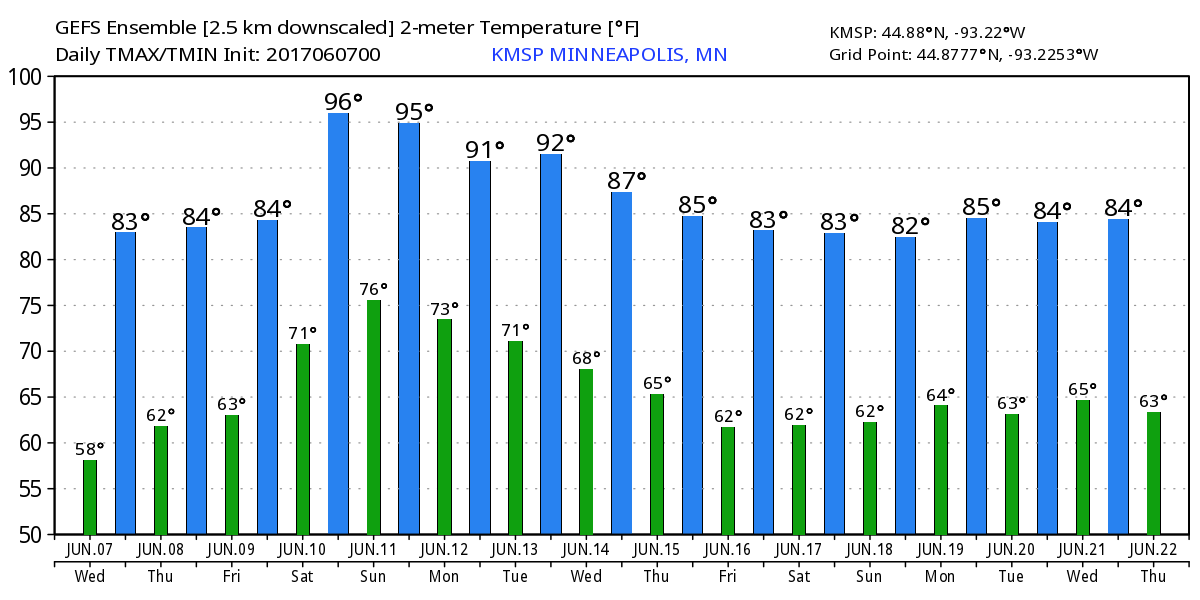
Temperature Outlook
Here's the temperature outlook from 2 different models through the the 3rd weekend of June. Note that the ECMWF keeps highs around 90 this weekend, while GEFS brings highs in the low to mid 90s through Tuesday. Stay tuned for more!
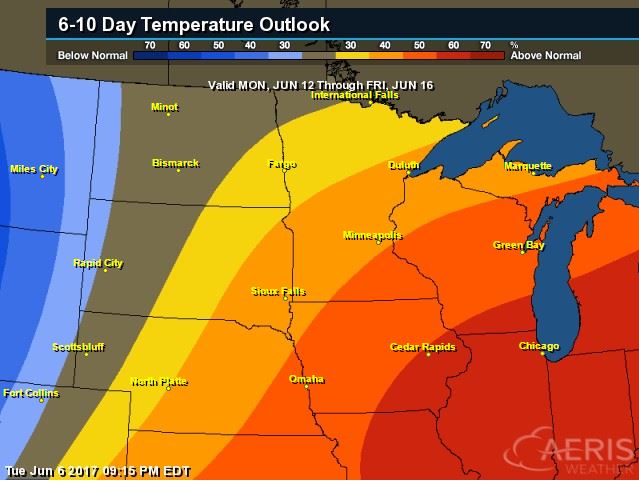
8 to 14 Day Temperature Outlook
According to NOAA's CPC, the extended temperature outlook through June 15th suggests warmer than average temperatures moving in across the Upper Midwest and Great Lakes Region.
___________________________________________________________
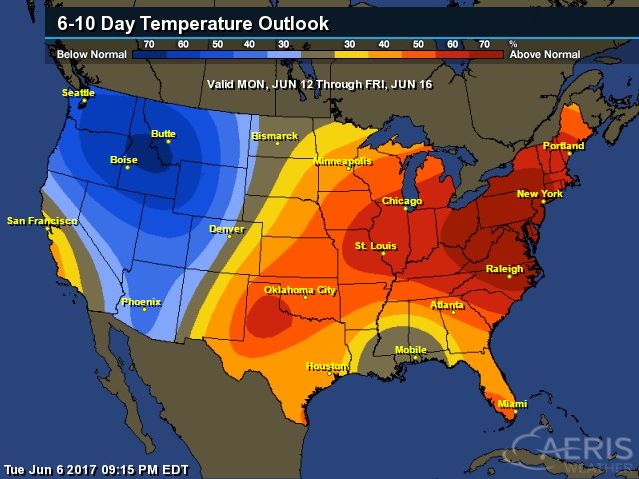
Extended Temperature Outlook
According to NOAA's CPC, the extended temperature outlook through June 15th shows warmer than average temperatures settling in across the Eastern two-thirds of the nation, while the Western third of the nation will be cooler.
 ____________________________________________________________
Temperature Trend
Here's the temperature trend through the middle part of next week. Cooler air looks to continue in the Eastern US through the weekend. Meanwhile, a big blob of warmer than average weather develops in the Western US and pushes into the Central and Eastern US by the weekend and next week.
Heavy rain will continue across the Southeastern US with spotty severe weather concerns through Thursday. There will also be spotty thunderstorms and could be strong to severe along the Front Range of the Rockies and also in the Northern Rockies.
5 Day Precipitation Outlook
According to NOAA's WPC, areas of heavy rain will continue across parts of Florida with some 2" to 4"+ possible. Another area of heavy rainfall could be found across the Pacific Northwest, while the Desert Southwest looks to remain very dry.
 ____________________________________________________________________
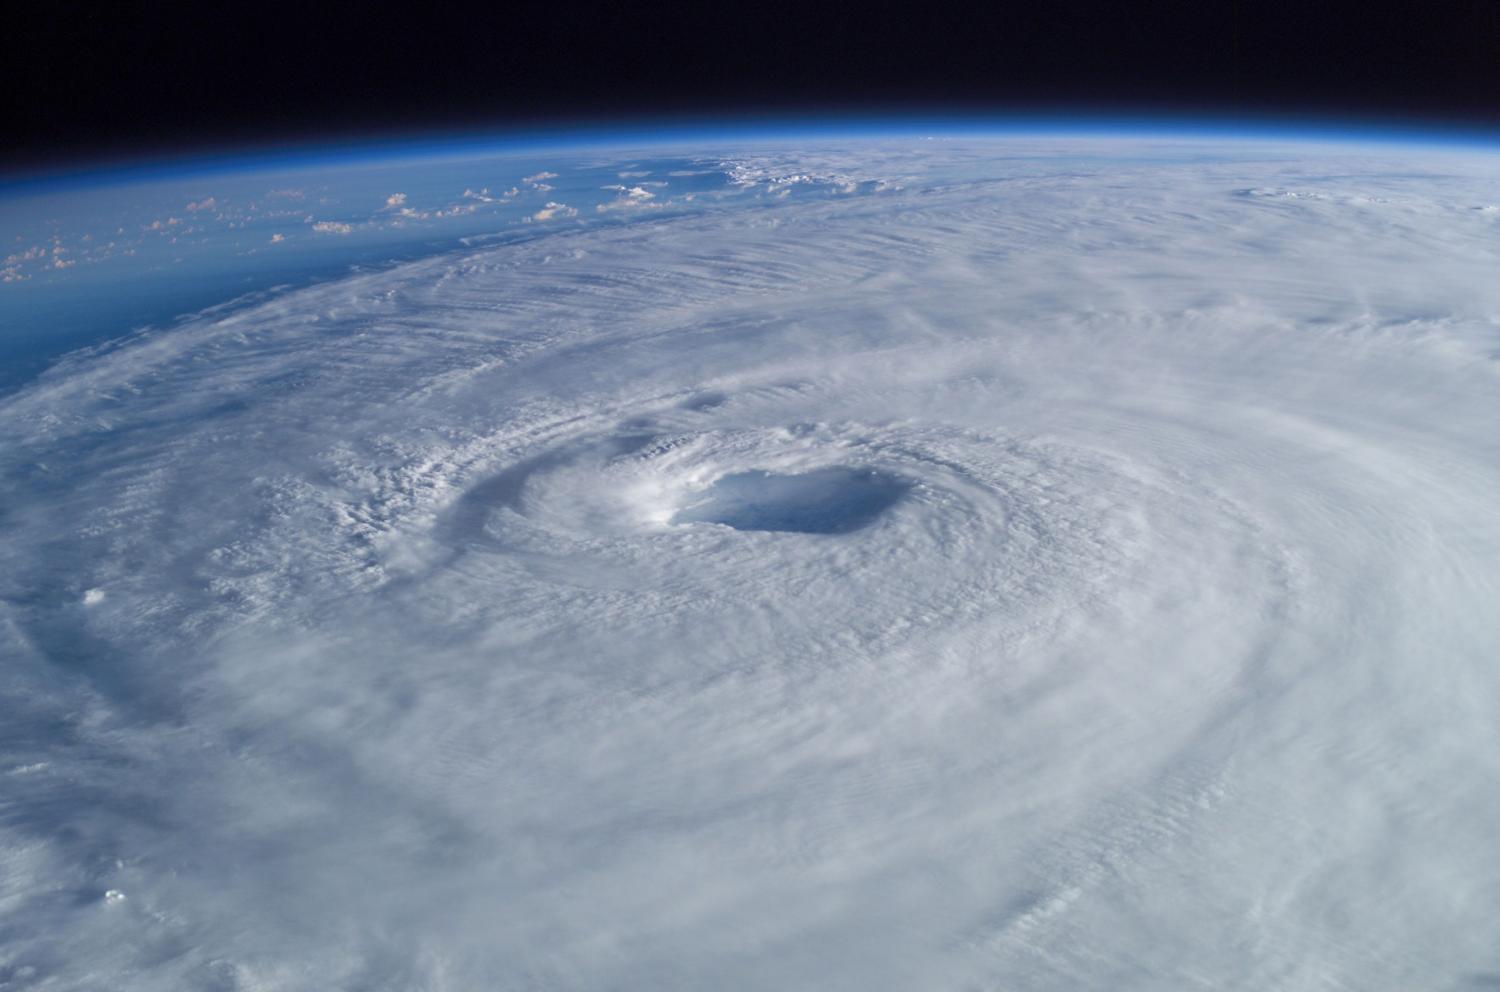
"Over $1.5tr of property value at risk of hurricane storm surge: CoreLogic"
"Analysis from global property information, analytics and data-enabled service provider, CoreLogic, reveals that almost 6.9 million homes along the Atlantic and Gulf coasts, with a combined reconstruction cost value (RCV) of over $1.5 trillion, are at risk of hurricane storm surge inundation. CoreLogic has released its 2017 Storm Surge Report, which reveals that a similar number of homes along the Atlantic and Gulf coasts are at risk of damage from hurricane storm surge inundation as that seen in 2016. The 2016 report claimed that more than 6.8 million homes were at risk with a total RCV of just over $1.5 trillion."
______________________________________________________________________________
"Summer U.S. Forecast: Hotter, More Polluted Than Usual"
The odds favor a hotter than average summer for much of the Western U.S., and a closer to average one for the Eastern U.S., according to the May seasonal forecasts from The Weather Company’s WSI branch, and Columbia University’s International Research Institute for Climate and Society (IRI). Meteorological summer began on June 1, and the first week of summer has been on the cool side for much of the United States. However, a shift in the jet stream pattern is coming late this week and into early next week, which will bring hot conditions to much of the eastern half of the U.S. WSI anticipates the possibility of a weak El Nino late summer, perhaps with enough influence on the tropical atmosphere to limit the magnitude of the heat across the northern Plains, Great Lakes, and Eastern U.S. Similarly, in an outlook issued in mid-May, a model-based outlook from IRI and NOAA gave slightly-better-than-even odds of El Niño developing. However, the offiical NOAA/IRI forecast from early May has lower odds, between 40% and 50%. If El Niño does not develop, the odds of stronger and more widespread U.S. heat this summer will rise. NOAA is predicting increased odds of a hot summer not only for the Western U.S., but also for the South and Northeast. WSI also predicts a hot summer for the Southeast during July and August. So, what does this mean for air pollution levels this summer?
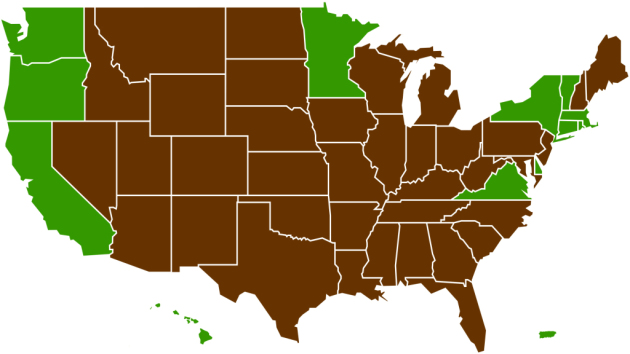
"As far as these states are concerned, the Paris climate agreement is still on"
"A group of 13 states and territories have banded together to fill the ginormous U.S.-shaped hole in the Paris Agreement. After Trump announced on Thursday that he would extricate the U.S. from the accord, governors in Washington, California, and New York quickly announced they would forge on without him. The United States Climate Alliance now includes Oregon, Minnesota, Vermont, Puerto Rico, and more (see all the states shaded in green above). The group accounts for roughly 35 percent of the U.S. economy. While the legal implications of the alliance are still murky — states are not constitutionally allowed to join interstate compacts in some cases — the political ramifications are obvious. The Climate Alliance states are framing the effort as a way to resist the roadblocks Trump has thrown in front of environmental momentum, by pledging to stay on track for Paris agreement goals and Clean Power Plan commitments with or without presidential support."
(Image Credit: Shutterstock via Grist.org)
_______________________________________________________________
"Everything we know about NASA's plan to fill the sky with colorful, artificial clouds"
"Later in June, people in the United States' mid-Atlantic region will likely be treated to a unique early-morning sight: colorful artificial clouds, courtesy of NASA. The blue-green and red clouds will be produced by the launch of a Terrier Improved Malemute sounding rocket carrying 10 canisters, which will be deployed approximately five minutes after the launch. These canisters will release the colorful vapor trail, which allow NASA's scientists to track how particles move in space and learn more about upper atmospheric winds. Though vapor tracers have been used by scientists in the past, the multi-canister ampoule ejection system onboard this mission will allow scientists to cover a much larger area than previous tests, the NASA website notes. The brightly hued clouds won't pose a threat to people on the ground, NASA's website assures; the vapors are released between 50 and 248 miles above Earth, and the metals they contain — including barium, lithium and tri-methyl aluminum — are similar to those found in fireworks."
(Image Credit: KARL-JOSEF HILDENBRAND/Getty Images via MIC.com)
_________________________________________________________________________________
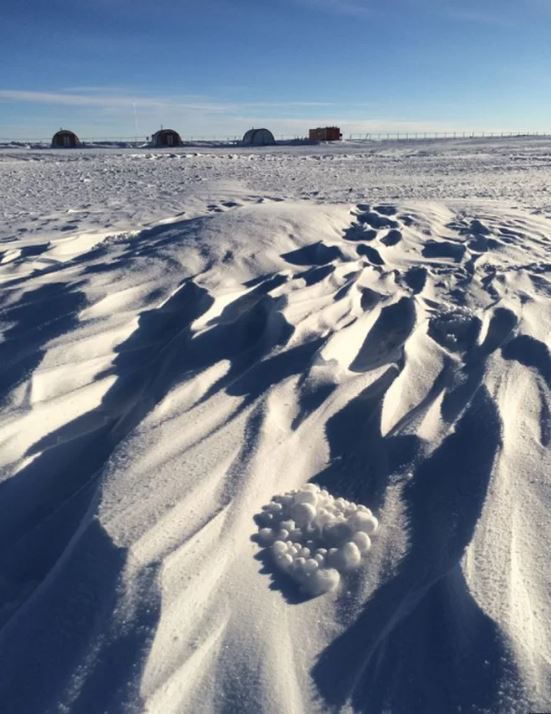
"Snowball 'Tumbleweeds' Blow Across Antarctica"
"Tumbleweeds may be iconic symbols of the American West, but regions around the world have their own versions of the wind-blown plants — even Antarctica. Antarctica's "tumbleweeds" look more like snowballs, but like their western namesake, they are created by the wind. Known as "yukimarimo," the wind-made snowballs were first discovered in 1995 by Japanese researchers who named the objects using the words "yuki," meaning "snow," and "marimo," meaning "moss balls." Yukimarimo develop when a rapid drop in temperatures causes a layer of frost to form on the snow. Winds pick up the frost's ice crystals and form them into balls that then tumble across the Antarctic landscape."
See more from LiveScience HERE:
(Known as "yukimarimo," the wind-made snowballs were first discovered in 1995 by Japanese researchers who named the objects using the words "yuki," meaning "snow," and "marimo," meaning "moss balls." Credit: C. Dangoisse/ESA)
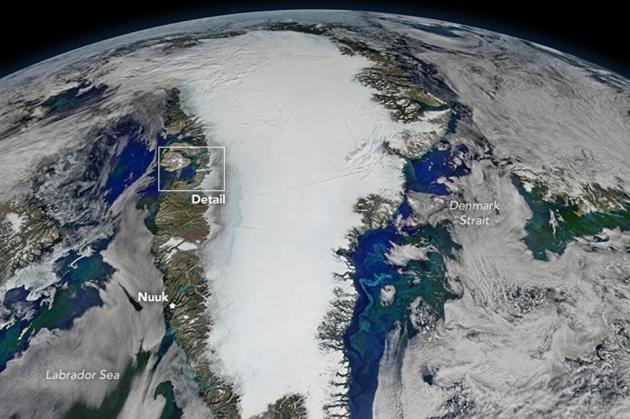
 _____________________________________________________________________________"Meltwater From Greenland May Be Fertilizing The Food Web"
Greenland is a key actor in the climate story. The Greenland Ice Sheet in combination with the Antarctic Ice Sheet contain about 99% of the planet's freshwater. It is about three times the size of Texas and has a notable influence on weather patterns, sea level, and climate feedbacks. According National Snow and Ice Data Center, if all of frozen water on Greenland melted, sea level would increase by 20 feet. This is the common "OMG!" fact cited by the media, policymakers and many scientists. However Greenland's freshwater melt is far from being a one-trick pony. A new study just published in the American Geophysical Union's journal Geophysical Research Letters provides a fascinating look at the complex relationships among Greenland, coastal ecosystems, and the marine food web. The lead author of the study is Professor Kevin Arrigo, a polar oceanographer at Stanford University. He told me by email: "Our research shows that as the Greenland ice sheet melts, it releases freshwater and any associated nutrients into the northern Labrador Sea. We were surprised to find that the arrival of this meltwater into coastal Greenland during the summer stimulates the dramatic growth of phytoplankton, the tiny plants at the base of the marine food web. It is possible that as the melting of Greenland’s glaciers accelerates in the coming years, that the biological productivity could increase as well, resulting in an alteration of its coastal ecosystems.""
See more from Forbes HERE:
 ______________________________________________________________
See more from LiveScience HERE:
(Known as "yukimarimo," the wind-made snowballs were first discovered in 1995 by Japanese researchers who named the objects using the words "yuki," meaning "snow," and "marimo," meaning "moss balls." Credit: C. Dangoisse/ESA)
Greenland is a key actor in the climate story. The Greenland Ice Sheet in combination with the Antarctic Ice Sheet contain about 99% of the planet's freshwater. It is about three times the size of Texas and has a notable influence on weather patterns, sea level, and climate feedbacks. According National Snow and Ice Data Center, if all of frozen water on Greenland melted, sea level would increase by 20 feet. This is the common "OMG!" fact cited by the media, policymakers and many scientists. However Greenland's freshwater melt is far from being a one-trick pony. A new study just published in the American Geophysical Union's journal Geophysical Research Letters provides a fascinating look at the complex relationships among Greenland, coastal ecosystems, and the marine food web. The lead author of the study is Professor Kevin Arrigo, a polar oceanographer at Stanford University. He told me by email: "Our research shows that as the Greenland ice sheet melts, it releases freshwater and any associated nutrients into the northern Labrador Sea. We were surprised to find that the arrival of this meltwater into coastal Greenland during the summer stimulates the dramatic growth of phytoplankton, the tiny plants at the base of the marine food web. It is possible that as the melting of Greenland’s glaciers accelerates in the coming years, that the biological productivity could increase as well, resulting in an alteration of its coastal ecosystems.""
See more from Forbes HERE:
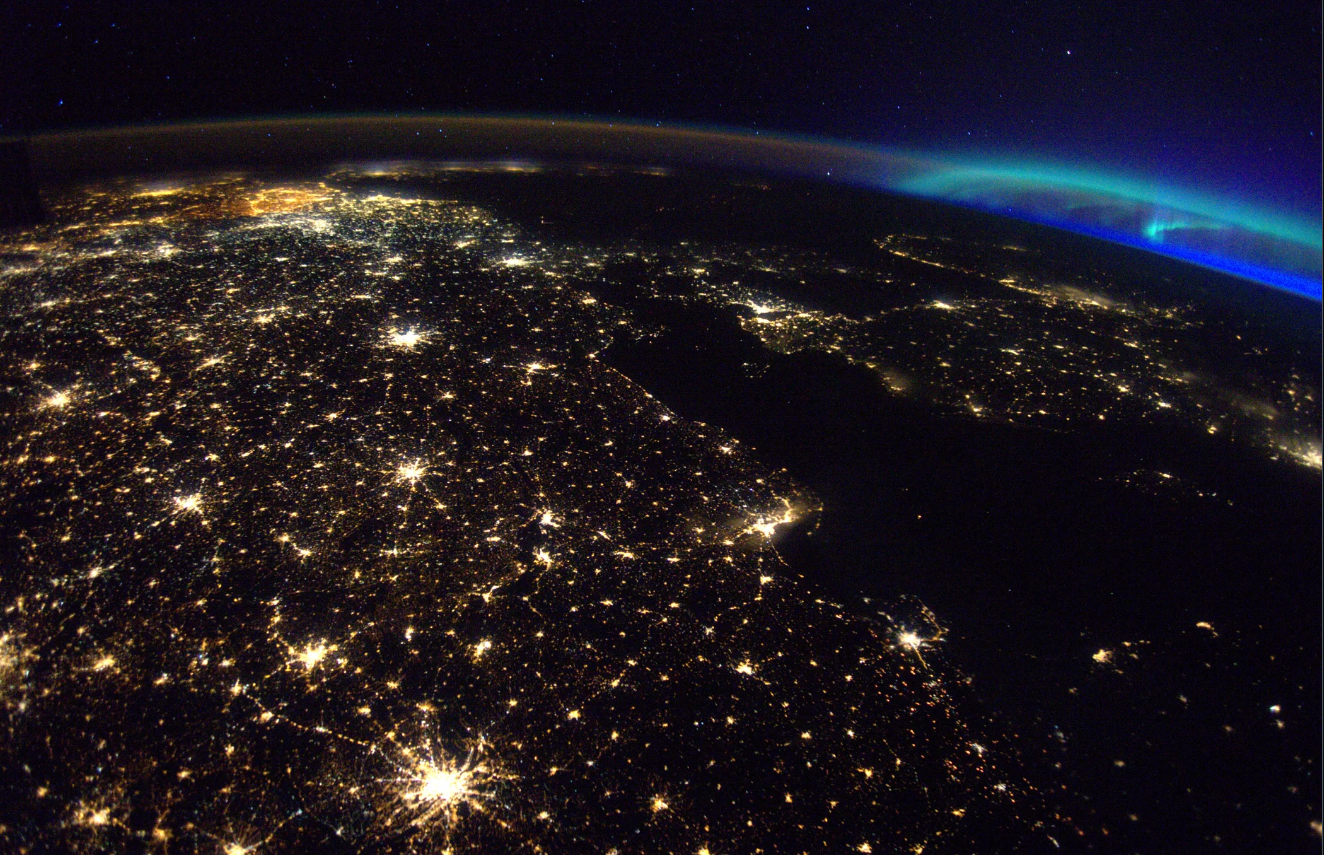
"Northern Lights from Space! Astronaut Captures Aurora Over Europe"
"The enchanting blue and green lights of an aurora dance above the city lights of Northern Europe in a stunning new image taken by an astronaut in space. In between mission tasks and scientific experiments aboard the International Space Station (ISS), French astronaut Thomas Pesquet has captured some amazing images from the orbiting outpost. In a recently shared snapshot by Pesquet, the aurora borealis can be seen in the top right corner of the frame, with the sparkling lights of Northern Europe's cities in the foreground."
______________________________________________________________________
"Report: National Weather Service meteorologists ‘fatigued’ and ‘demoralized’ by understaffing"
The employees of the National Weather Service are demoralized, according to a recent report by the Government Accountability Office. They are understaffed and spread thin, covering shifts and positions beyond what they were hired to fill. The weather never sleeps, and apparently neither does the Weather Service. Between 2014 and 2016, the number of vacant staff meteorologist positions increased 57 percent. In the same time, management vacancies decreased by 29 percent. The mission of the Weather Service — to protect lives and property — is critical, so the employees are completing the tasks. But it comes at a cost. The GAO used some pretty gloomy language to describe the employees’ current state of mind (emphasis mine):
1.) “. . . operational unit managers and staff experienced stress, fatigue, and reduced morale resulting from their efforts to cover for vacancies.”
2.) “. . . but the long-term result has been that employees are fatigued and morale is low.”
3.) “. . . staff are getting worn down covering extra forecasting shifts.”
4.) “One operational unit manager we interviewed said staff in his unit were demoralized because they had continued to cover the workload for multiple vacancies.”
5.) “. . . staff are concerned that the agency may be intentionally leaving vacant positions open to downsize.”
6.) “NWS headquarters officials acknowledged that vacancies had created challenges and stress …”
See more from WashingtonPost HERE:
 ______________________________________________________________________________"NOAA forecasts busy hurricane season for Atlantic"
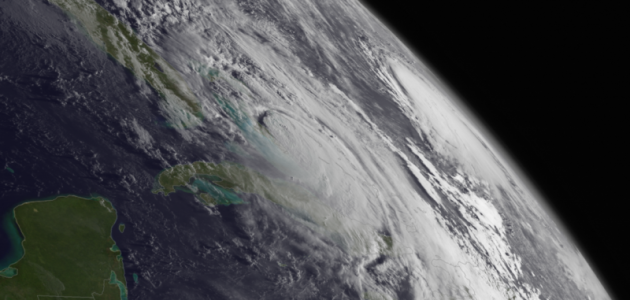
"Less than a year after Hurricane Matthew raked the East Coast, killing 34 people and causing $10 billion in damage in the U.S. alone, coastal areas are once again preparing for the onset of the Atlantic hurricane season. This year, forecasters with the National Oceanic and Atmospheric Administration are expecting to see above-average storm numbers in the Atlantic, despite the uncertainty of whether an El Niño will develop over the summer. The forecast is currently for 11 to 17 named storms to form, of which five to nine are expected to become hurricanes, and two to four major hurricanes. The forecast, though, “does not predict when, where, and how these storms might hit,” Ben Friedman, the acting NOAA administrator said during a press conference, as he and other officials urged coastal residents to begin their preparations."
See more from Salon.com Via Climate Central HERE:
(Image credit: AP Photo/Stephen B. Morton via Salon.com & Climate Central)
 ________________________________________________________________________
"As hurricane season begins, NOAA told to slow its transition to better models"
________________________________________________________________________
"As hurricane season begins, NOAA told to slow its transition to better models"
"NOAA could become a second- or third-tier weather forecasting enterprise... It's a lousy time to be a US weather forecaster. Even as the Atlantic Ocean heats up, wind shear falls, and the potential for an active hurricane season looms, vacancies have been mounting at the National Hurricane Center in Miami and at National Weather Service offices around the country. According to a new US Government Accountability Office report, morale has sunk among forecasters, and increasing vacancies have led to an inability to provide timely severe weather information to state and local emergency managers. Instead of addressing this problem, the proposed budget released by the Trump administration late last month would exacerbate the tempest. Overall, the President's budget for the National Oceanic and Atmospheric Administration sought $1.06 billion for the National Weather Service, down six percent from 2017. But the devil is in the details, and some of these details are indeed devilish."
See more from Arstechnica HERE:
(Image Credit: NOAA - Hurricane Matthew is seen in 2016, closing in on Florida)
___________________________________________________________________________
Thanks for checking in and don't forget to follow me on Twitter @TNelsonWX
2.) “. . . but the long-term result has been that employees are fatigued and morale is low.”
3.) “. . . staff are getting worn down covering extra forecasting shifts.”
4.) “One operational unit manager we interviewed said staff in his unit were demoralized because they had continued to cover the workload for multiple vacancies.”
5.) “. . . staff are concerned that the agency may be intentionally leaving vacant positions open to downsize.”
6.) “NWS headquarters officials acknowledged that vacancies had created challenges and stress …”
See more from WashingtonPost HERE:
"Less than a year after Hurricane Matthew raked the East Coast, killing 34 people and causing $10 billion in damage in the U.S. alone, coastal areas are once again preparing for the onset of the Atlantic hurricane season. This year, forecasters with the National Oceanic and Atmospheric Administration are expecting to see above-average storm numbers in the Atlantic, despite the uncertainty of whether an El Niño will develop over the summer. The forecast is currently for 11 to 17 named storms to form, of which five to nine are expected to become hurricanes, and two to four major hurricanes. The forecast, though, “does not predict when, where, and how these storms might hit,” Ben Friedman, the acting NOAA administrator said during a press conference, as he and other officials urged coastal residents to begin their preparations."
See more from Salon.com Via Climate Central HERE:
(Image credit: AP Photo/Stephen B. Morton via Salon.com & Climate Central)
"NOAA could become a second- or third-tier weather forecasting enterprise... It's a lousy time to be a US weather forecaster. Even as the Atlantic Ocean heats up, wind shear falls, and the potential for an active hurricane season looms, vacancies have been mounting at the National Hurricane Center in Miami and at National Weather Service offices around the country. According to a new US Government Accountability Office report, morale has sunk among forecasters, and increasing vacancies have led to an inability to provide timely severe weather information to state and local emergency managers. Instead of addressing this problem, the proposed budget released by the Trump administration late last month would exacerbate the tempest. Overall, the President's budget for the National Oceanic and Atmospheric Administration sought $1.06 billion for the National Weather Service, down six percent from 2017. But the devil is in the details, and some of these details are indeed devilish."
See more from Arstechnica HERE:
(Image Credit: NOAA - Hurricane Matthew is seen in 2016, closing in on Florida)
___________________________________________________________________________
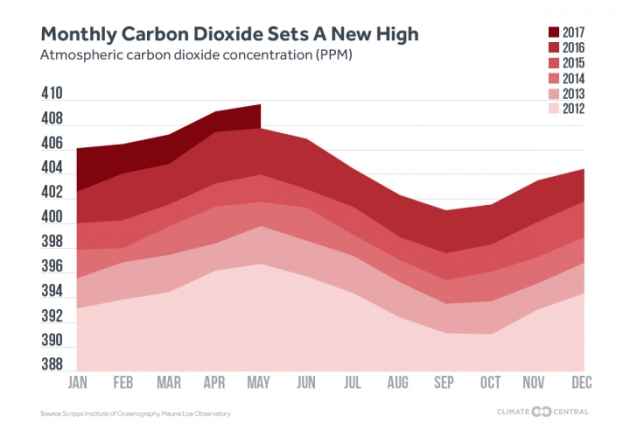
"Carbon Dioxide Set an All-Time Monthly High"
"With May in the books, it’s official: carbon dioxide set an all-time monthly record. It’s a sobering annual reminder that humans are pushing the climate into a state unseen in millions of years. Carbon dioxide peaked at 409.65 parts per million for the year, according to data from the National Oceanic and Atmospheric Administration. It’s not a surprise that it happened. Carbon dioxide levels at Mauna Loa Observatory in Hawaii peak in May every year."
See more from Climate Central HERE:
______________________________________________________________________
See more from Climate Central HERE:
______________________________________________________________________
Thanks for checking in and don't forget to follow me on Twitter @TNelsonWX

No comments:
Post a Comment