35.1" snow in St. Cloud so far this winter season.
20: days with at least a trace or more of snow so far in January.
14: subzero nights so far in January.
20: subzero nights so far this winter season.
33: average number of subzero nights at STC during an entire winter season.
-3.7 F. Departure from normal so far in January in the St. Cloud metro area.
 Slushy Inch?
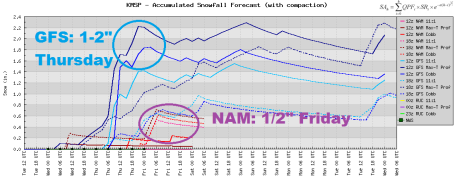
 The latest NAM model (usually the most reliable) is printing out .09" liquid. Assuming a 10/1 snow/rain ratio that comes out to roughly 1" of snow. Rush hour Thursday may be a bit slushy and slow.
Is The Worst Behind Us? My cautious answer is a qualified yes. I may live to regret this spurt of sunny optimism, but my semi-educated
hunch is that we probably won't get any colder than -29 F. in February. Picking up over 2 minutes of additional daylight every day it gets progressively harder to get below zero, especially the last week or two of February. Will we see more subzero nights? Absolutely? Will we experience another round of 5 nights/row below zero? Maybe not. Next week we'll probably endure 3 or 4 nights below zero, daytime highs in single digits and low teens - not quite as cold as it got late last week. To see the January numbers for St. Cloud click
here.
Dueling Models. Always fun when the weather models we use have a difference of opinion on what is going to happen next. The GFS model is hinting that Thursday may be the bigger snow day, a potential for 1-2". But the (usually more reliable/accurate) NAM weather model is suggesting a coating Thursday, with 1/2" or so on Friday from a second clipper. Regardless of which model verifies - the heaviest amounts should pass north/east of the Twin Cities and St. Cloud later this week.
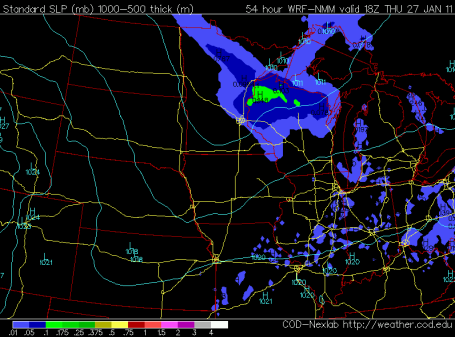
Clipper #1. The first (weak) clipper dives southeastward Thursday, putting down 1/2 to 2" from the Minnesota Arrowhead into northern Wisconsin. Models are hinting at 1/2" snow Wednesday night in the St. Cloud metro area.
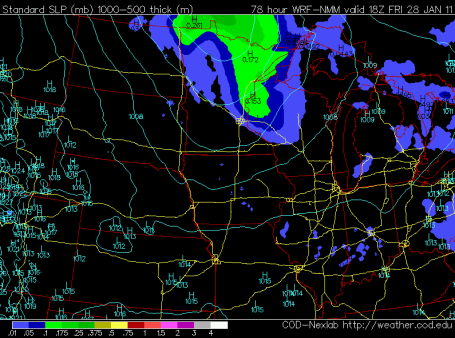
Clipper #2. A stronger clipper arrives Friday, when highs may top 32 F. across portions of central and southern Minnesota, a stronger north-south temperature differential whipping up heavier snow over central and northern Minnesota - as much as 2-4" over the northern third of Minnesota and parts of central and northern Wisconsin. A light coating to 1/2" is possible in the St. Cloud metro area, but once again the heaviest snow should stay mostly north/east of I-94.
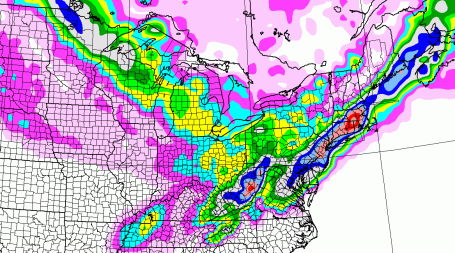
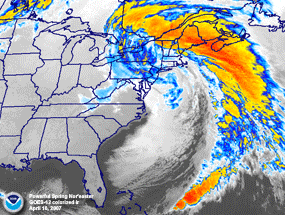
Snow Potential? This is the GFS prediction for accumulated snow (by midday Sunday), showing the next nor'easter dumping potentially heavy snow from Washington D.C. and Philadelphia to New York, Hartford and the Boston area. As much as 3-6" may accumulate over far northern Minnesota from a series of clippers, under 1/2 or 1" in St. Cloud and the Twin Cities.
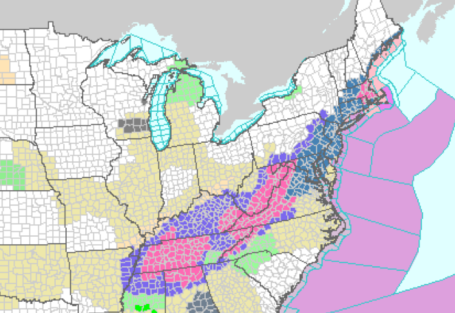
Watches and Warnings. Note the lack of any fancy colors over Minnesota - remarkably quiet weather close to home (compared to the rest of the nation). A strengthening southern storm will track right up the coast - and NOAA has already issued Winter Storm Watches and Warnings from Huntsville, Alabama to Boston. The latest update is
here.
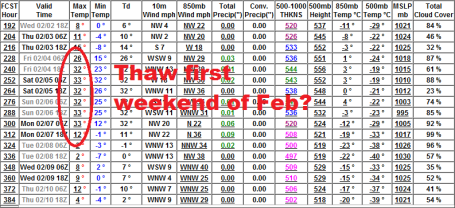
180 Degree Turn. Here's the thing about predicting more than 4-7 days out - things can turn on a dime. Yesterday's GFS guidance was suggesting subzero weather for the second week of February. Latest models are hinting at a thaw for the first weekend of February, from roughly the 4th through the 7th. What to believe? I want to see a couple more computer runs. No doubt next week will be bitter, a string of days in single digits to low teens with a handful of subzero lows. Not quite as cold as late last week, but a subtle (yet blunt) reminder that spring fever is NOT right around the corner.
What Is A Nor'easter? NOAA has more
information on these massive coastal storms which tend to intensify off the Outer Banks of North Carolina, tapping warmth and moisture from the Gulf Stream, mixing with frigid, Canadian air to dump windswept snow and ice on the northeast. "
The phrase, “crowded coastline” might conjure up images of tanned tourists on the warm, sunny beaches of Florida and California. But, the most crowded coastal corridor in the United States stretches between Washington, D.C., and Boston — and includes the densely urban cities of Baltimore, Philadelphia and New York. In this region, where 180 coastal counties support 77 percent of the area’s total population, the weather for more than half the year is far from warm and sunny. In fact, it’s the active season for a weather phenomenon known as nor’easters."
Photo credit: April 2007 nor'easter, NOAA.
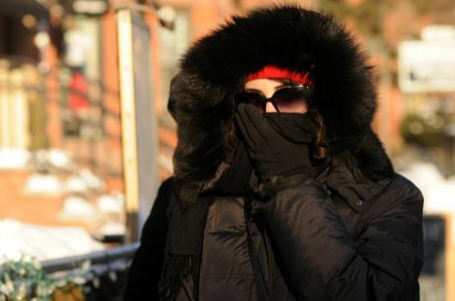
New England Endures A Bitter Blast. Misery loves company. It helps to know that other Americans are feeling our pain. From an
article at USA Today: "
Train equipment froze, cars sputtered, schools canceled classes and cold-weather enthusiasts opted to stay inside Monday as a bitter blast of below-zero temperatures with promises of minus-50 wind chills gripped the Northeast. The gasp-inducing cold tested the mettle even of New Englanders, who pride themselves on winter hardiness. "Snot-freezing cold," was how Kelly Walsh, 28, described it, walking home from an auto parts store in Vermont'
s capital after buying a new battery for her car, which wouldn't start Monday morning. It was minus 21 there at 7 a.m." Snot-freezing cold? Have to remember that one.
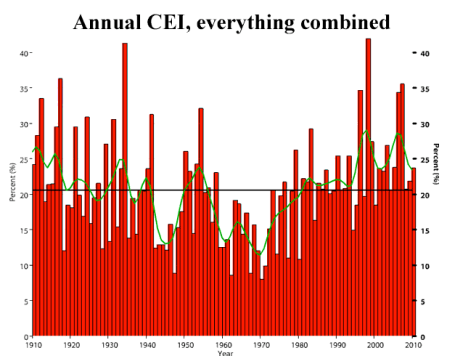
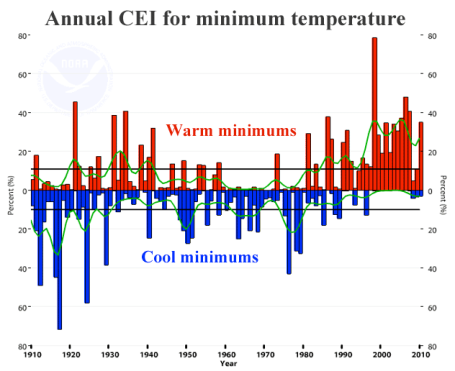
Climate Extreme Index (CEI). From Jeff Masters at Wunderblog, a
post focused on extreme weather; is it really on the rise, or is it just our perception?
The 7 most extreme years for excessive rainfall in the USA have been observed since 1995. 2010 was 5th on the list, dating back to 1910. "
The Annual Climate Extremes Index (CEI), updated through 2010, shows that U.S. climate has generally been getting more extreme since the early 1970s, but that the 2010 climate was just slightly more extreme than average. On average since 1910, 21% of the U.S. has seen extreme conditions in a given year (thick black line), and in 2010 this number was about 24%." Graphic courtesy of NCDC.
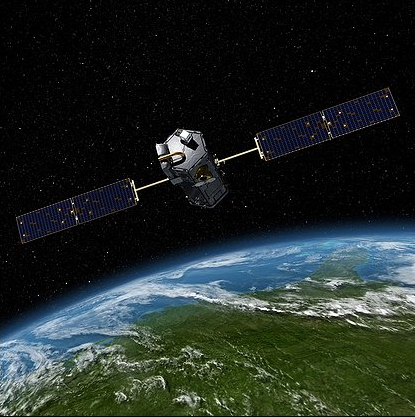
Scientists Hopes For Climate Data Are Up In The Air. The Washington Post has an
article pointing out the need for accurate, reliable climate data - much of which comes from a constellation of satellites. Budget cutbacks and shortfalls may impact our ability to monitor Earth and provide scientists with the data necessary to diagnose what is happening on a planetary scale: "
Shortly after it lifted off in February 2009, NASA's Orbiting Carbon Observatory crashed into the Pacific Ocean near Antarctica. With that, a $250 million investment became scrap metal on the ocean floor and an effort to begin using satellites to measure atmospheric carbon dioxide and trace emission-reduction actions was dealt a huge setback. Scientists say the information the OCO was intended to collect is a crucial piece of the data needed not only by those monitoring the Earth's environment but also by federal officials struggling to understand possible national security implications of those climate changes. But the OCO's failure highlighted an even broader problem: Understanding climate change requires a breadth of information on variables from atmospheric carbon dioxide to the condition of Arctic ice, and scientists say that satellites are vital for this. Yet at a time where the massive Larsen B Ice Shelf in Antarctica seems intact one day and then collapses into the sea the next, the system of continuous, reliable satellite observation of Earth is at risk, with some aging satellites in dire need of replacement."
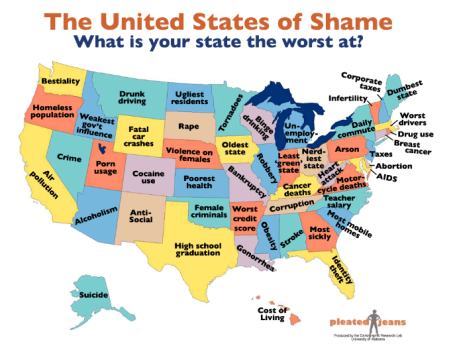
The United States Of Shame. Minnesota's claim to fame is....tornadoes? That's a bit of a stretch, but we did endure 104 tornado touchdowns in 2010. Worst drivers: Massachusetts. Poorest health: Kansas. Most robberies: Illinois. Every state has something to brag about, and something the local Chamber of Commerce wishes would just go away. From a random
article highlighting our nation's low-lights, state-by-state: "
Whether it’s a fat population, high rate of STDs or excessive tax rate, it turns out that every state ranks dead last in at least one unsavory category. Check out the map (click image to enlarge) to see what your state is the worst at, then review additional stats and references."
Apple To Add NFC Functionality To iPhone and iPad. Using your iPhone to purchase a cup of coffee at Caribou, or that sweet treat in the company vending machine? The day may be coming sooner than you think. Hallelujah! From an
article at mashable.com: "
Apple will add NFC (near-field communication) capabilities to its next generation iPhone and iPad, claims Richard Doherty, director of the consulting firm Envisioneering Group. NFC is a form of wireless data transfer over short (up to 4-inch) distances, which could be used to make purchases with a mobile device. If Apple ties the technology with customers' iTunes accounts, making purchases might become as easy as swiping your phone over a specifically designed sticker or payment terminal. According to Doherty, Apple is thinking of starting a mobile payment service as early as mid-2011, integrating it into iTunes and adding the familiar concept of loyalty credits and points into the service. Apple hass already designed a prototype payment terminal, Doherty claims, which may be heavily subsidized or even given away to small businesses, jump starting the service."
Email
- 107 trillion – The number of emails sent on the Internet in 2010.
- 294 billion – Average number of email messages per day.
- 1.88 billion – The number of email users worldwide.
- 480 million – New email users since the year before.
- 89.1% – The share of emails that were spam.
- 262 billion – The number of spam emails per day (assuming 89% are spam).
- 2.9 billion – The number of email accounts worldwide.
- 25% – Share of email accounts that are corporate.
Websites
- 255 million – The number of websites as of December 2010.
- 21.4 million – Added websites in 2010.
Web servers
- 39.1% – Growth in the number of Apache websites in 2010.
- 15.3% – Growth in the number of IIS websites in 2010.
- 4.1% – Growth in the number of nginx websites in 2010.
- 5.8% – Growth in the number of Google GWS websites in 2010.
- 55.7% – Growth in the number of Lighttpd websites in 2010.
Digital Trivia.
Here is more than you ever wanted to know about the web and e-mail in 2010, courtesy of pingdom.com. Just think of all the fun at your next party!
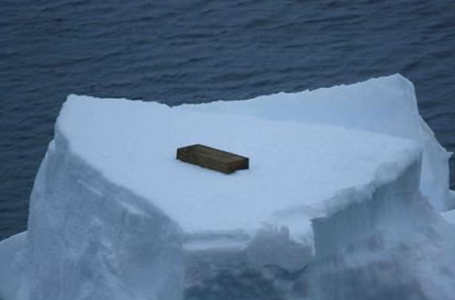
How Did A Block Of Wood Wind Up On An Iceberg? An icebreaker on its way to Antarctica spotted this random block of wood on top of an iceberg - no idea how it got there. From an
article at neatorama.com: "
I’ve heard the Southern Ocean attracts a hardy individual but a block of wood on an iceberg is ridiculous. This lonely piece of timber was spotted on the top of a small berg at 66 degrees south, just north of Commonwealth Bay. Wildlife watchers near Aurora Australis’ bridge first thought it was a relaxing seal but it was soon apparent it was rectangular in shape.How it got to such a prominent position, instead of just floating around, is anyone’s guess."
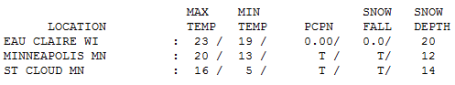
 Tuesday Memories
. Yesterday's high of 20 at KMSP was only 2 degrees cooler than average,
16 at St. Cloud and 23 at Eau Claire, Wisconsin, which has 20" of snow on the ground.
 Paul's SC Times Outlook for St. Cloud and all of central Minnesota:
TODAY: More clouds than sun, "average" temperatures. Winds: W 10. High: 21
WEDNESDAY NIGHT:
Light snow, up to 1/2" possible in the St. Cloud area. Low: 13
THURSDAY: Slick start, flurries taper early. "Grilling weather". High: 30
FRIDAY: Coating of flurries? Fleeting thaw. Probably the mildest day of the week. Low: 22. High: 32
SATURDAY: Better day to play in the snow. Mostly cloudy, turning cooler. Low: 16. high: 23
SUNDAY: Gusty, turning sharply colder. Low: -2. High: 9
MONDAY: Blue sky, coldest day of the week? Low: -10. High: 8
TUESDAY: Clouds increase, still storm-free. Low: -4. High: 13
Weather Complexities
"Isn't it interesting that the same people who laugh at science fiction listen to weather forecasts and economists?" quipped Kelvin Throop III. Predicting the future is not for the faint of heart.
As time goes on I have even more respect for the complexities of the atmosphere; how everything from cold water in the Pacific to warm ocean currents in the Arctic have a domino effect on Minnesota conditions. It's a puzzle with a seemingly infinite number of pieces. Computers help, but whether its La Nina or the rate of melting over Greenland, the models are only as good as our understanding of larger forces, some beyond our comprehension. The long range forecast accuracy improves roughly 1% every year, but there is a financial limit to how far out we can look with any precision. Launching weather balloons and running supercomputer models is an expensive undertaking.
Thursday or Friday may be the 2 most comfortable days to check out the ice carvings at Rice Park, part of the St. Paul Winter Carnival. Highs brush 32F Friday, before the mercury tumbles over the weekend. A rerun of goosebumps next week may give rise to another thaw the first weekend of February. In a word: progress!
Visualizing (Extreme) Sea Level Rise. Now you can use Google Earth to visualize a worst-case scenario, in this case a how a 100 meter sea level rise would impact London. This scenario would require an almost complete meltdown of Greenland ice, and very significant melting of Antarctica, statistically possible, but the likelihood of this happening (at least in the 21st century) is very low. From a Google
post: "
We've discussed how flooding can be visualized a few times in Google Earth, because it's a great medium with which to show off catastrophes such as that. In addition to helping with fresh imagery from recent floods in Pakistan and Nashville, it's also been used to help bring to life the 1966 flood in Florence and an animation of how rising sea levels would affect various cities. Today's post comes from Richard Treves over at Google Earth Design. He's recently read Will Self's "Book of Dave", which imagines a future where sea levels have risen over 100 meters. Richard has taken that idea and given step-by-step instructions on how to simulate a 100m rise in sea level for any area of the world. I took his example and put it over London, with the results seen here."
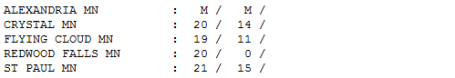
Man-Made Climate Change Is Thousands Of Years Old. The author of this study correctly points out that deforestation and land-use has had a significant impact on climate over the span of thousands of years. This may be true, but we have accelerated climate change by releasing carbon (that took many millions of years to form into oil, gas and coal) and releasing it into the atmosphere in a geological blink of an eye, in the last 250 years, most of the greenhouse gas emissions in the last 50-75 years. From an
article at planetsave.com: "
Manmade climate change is not only a thing of the last hundred years, according to new research from scientists at the Ecole Polytechnique Federale de Lausanne (EPFL). The Roman Conquest, expansion of civilization in China, the Black Death, and the discovery of America, amongst other historical landmarks, have all had large impacts on the climate. “Humans didn’t wait for the industrial revolution to provoke environment and climate change. They have been having an influence for at least 8000 years,” said Jed Kaplan, a Swiss National Science Foundation professor at EPFL, who along with his colleague Kristen Krumhardt, have developed a computer model that reveals an obvious linkage between population increase and deforestation."
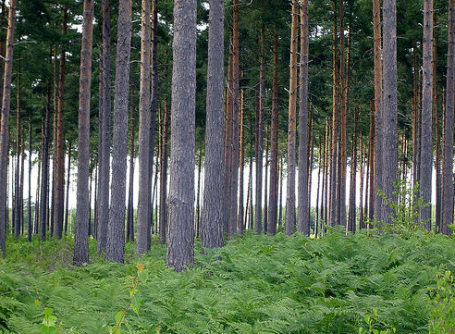
Evidence In Canadian Arctic Points To Volcanic Eruptions As Cause Of Mass Extinction. From a recent
article at the Vancouver Sun: "
A mass extinction 250 million years ago was caused by massive volcanic eruptions that burned significant volumes of coal, causing runaway global warming to impact the temperature and acidity of the world’s oceans, Canadian researchers found in new research announced Sunday. "This could literally be the smoking gun that explains the latest Permian extinction," said Steve Grasby, a researcher at the University of Calgary’s department of geoscience. During the Permian extinction 95 per cent of life was wiped out in the sea and 70 per cent on land. Unlike the demise of the dinosaurs 65 million years ago, where there is widespread belief that a meteorite was at least the partial cause, it is unclear what caused the Permian mass extinction."
Photo Credit:
Research discovered layers of coal ash in rocks from the extinction boundary in Canada's High Arctic that gives the first direct proof to support the belief that eruptions in what is known as the Siberian Traps, now found in northern Russia, produced ash clouds that had a broad impact on global oceans.
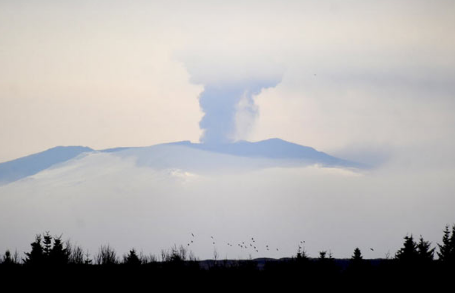
Trending Milder. Another graphic from Jeff Masters and his informative, must-read
Wunderblog, showing a graphic from NCDC, the National Climatic Data Center. This shows the number of record low temperatures (both warm and cold records for nighttime "lows") - with far more record (warm) nighttime temperatures than record cold readings, especially since the last 1990s.
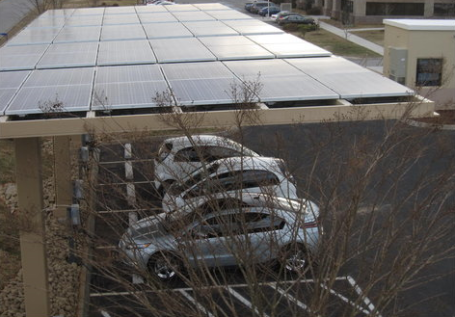
If You Build It, Will They Charge? It's a classic chicken and egg challenge facing EV's, electrical vehicles. Can you encourage enough people to purchase pure electric-powered vehicles without a critical mass of charging stations on interstates around the USA? Or do you need the charging stations (first), before a critical mass of consumers will make the jump to electrical vehicles? From an energy
blog at the New York Times: "
A transition to electric cars isn’t just a matter of the cars, but also of the infrastructure that goes with them, including public charging stations. The Electric Power Research Institute and the Tennessee Valley Authority plan to cut the ribbon on Tuesday on a prototype of a new kind of charging station, one that uses solar cells and batteries. But they do not work together in quite the way the public might expect. The initial installation has six parking stalls, one of them extra wide for handicapped drivers, with carport roofs covered with solar panels. There are three refrigerator-size battery packs in a building that is heated and air-conditioned."
12 Politicians And Execs Blocking Progress On Global Warming. From an
article at Rolling Stone: "
No one does more to spread dangerous disinformation about global warming than Murdoch. In a year of record heat waves in Africa, freak snowstorms in America and epic flooding in Pakistan, the Fox network continued to dismiss climate change as nothing but a conspiracy by liberal scientists and Big Government. Glenn Beck told viewers the Earth experienced no warming in the past decade — the hottest on record. Sean Hannity declared that "global warming doesn't exist" and speculated about "the true agenda of global-warming hysterics." Even Brian Kilmeade, co-host of the chatty Fox & Friends, laughed off the threat of climate change, joking that the real problem was "too many polar bears." Murdoch's entire media empire, it would seem, is set up to deny, deny, deny. The Wall Street Journal routinely dismisses climate change as "an apocalyptic scare," and Fox News helped gin up a fake controversy by relentlessly hyping the "climategate" scandal — even though independent investigations showed that nothing in the e-mails stolen from British climate researchers undercut scientific conclusions about global warming. Murdoch knows better. In 2007, he warned that climate change "poses clear, catastrophic threats" and promised to turn News Corp. into a model of carbon neutrality. But at his media outlets, manufacturing doubt about global warming remains official policy."


No comments:
Post a Comment