55.8" snow so far this winter in St. Cloud.
9" snow on the ground.
50% probability of a St. Cloud crest on the Mississippi River of 9.8 feet (flood stage is 9 feet). Predictions from the National Weather Service.
CHANCE OF EXCEEDING STAGES AT SPECIFIC LOCATIONS
        VALID MARCH 03, 2011 - 030811
LOCATION         90%   80%   70%   60%   50%   40%   30%
--------         ---   ---   ---   ---   ---   ---   ---

MISSISSIPPI RIVER
 ST CLOUD SCSU   8.8   9.2   9.3   9.5   9.8  10.0  10.2
(DATUM = 958.49) FLOOD STAGE = 9.0
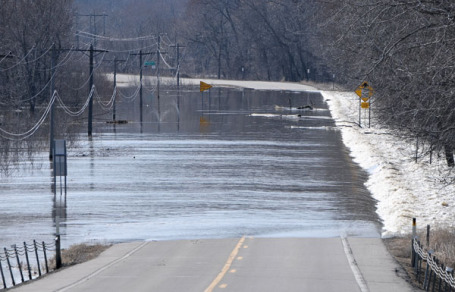
Flood Update. According to the local NWS office flood stage
in St. Cloud is 9 feet. There is a 50% chance of the Mississippi
River reaching 9.8 feet, a 30% probability of reaching 10.2 feet.
The risk is considerably higher downstream, closer to St.Paul,
Hastings and Red Wing, but residents living along and near the
Mississippi(and other smaller tributaries) should stay alert in
the coming weeks.
Update on Flood Risk for the Sauk River (from SCSU meteorologist D.J. Kayser):
As important as the Mississippi is in the STC area, especially revolving around flooding and what it could help mean down river in the cities -- I will always be more worried about the Sauk River in STC, especially since that floods VERY easily. Flood stage is 6', Moderate is 7'
LOCATION
90%
80%
70%
60%
50%
40%
30%
20%
10%--------
---
---
---
---
---
---
---
---
---
SAUK RIVER ST CLOUD
6.5
6.6
6.9
7.0
7.2
7.3
7.7
7.9
8.6(DATUM = 1034.63)
FLOOD STAGE =
6.0
Basically at around 6', we start seeing homes along the river flood, a couple parks (including the Knights of Columbus) flood, and the parking lot of Antons Restaurant become wet (and shortly there after the restaurant shuts down -- but they pride themselves on being along the river!). The forecasts say its gonna flood, and have a 60% chance of getting to moderate flood stage. A problem I see arising is that we (stupidly) have had construction on the river along Veterans Drive (right by the MAC and Knights of Columbus Park) as they decided to start work on a couple new bridges to try and ease traffic flow in the area. Of course, that means shutting down one side of the bridge during it and causing even more congestion, especially during winter. Anyway, they've been doing construction, building up banks, pounding pillars into the riverbed, etc all winter (and especially since we had that couple day thaw in February). I want to know how much this flooding is going to affect the construction... especially how much it might destroy what they have already accomplished. And how much this construction may actually block water from flowing down -- therefore flooding Knights more and pushing it awful close to County Road 138/54th Ave N. When we had the flooding the past few years, the water has come really close to that road. According to NWS data, the crest last year was 6.83 ft on 03/18/2010. We could definitely rival that this year.
According to the graph at the link below, it looks like they expect it to reach flood stage around the end of this month... then stay there for a good few weeks.
http://water.weather.gov/ahps2/weekly.php?wfo=mpx&gage=stcm5&view=1,1,1,1,1,1,1,1&toggles=10,7,8,2,9,15,6
. This is going to be a tough, potentially historic flood season for Minnesota and much of the Upper Midwest. The most snow in at least 2 decades, coupled with saturated soil, a fairly rapid thaw, and possible rain the latter half of March, could result in a worst-case scenario for the state's rivers and streams. The honest answer: we simply don't know how bad it's going to be, but it's time to prepare, even if you don't live in the flood plain, but near the flood plain. If flooding really is comparable to 1965 some neighborhoods that haven't seen flooding in 45 years or longer could be impacted. It's critical to err on the side of caution and safey.
Chaska, 1965. On Thursday I spent a few minutes chatting with Dan Luna, MIC at the Chanhassen NWS Office. He has a team of hydrologists (river forecasters) working with him, trying to get a handle on the severity of the flood risk. He told me a few things that made me do a double-take. Any given spring the probability of exceeding 1965's historic crest of the Mississippi River in St. Paul is 3%. This spring, it's somewhere between 40 and 50%. "Have you ever seen a risk that high?" I asked. The short answer. No. This year is off the scale, we're in uncharted waters. I asked when the flooding might be most severe. "We're most concerned about late March into mid April." Luna explained. He also said something I found interesting: "if we get a couple days above 40 that won't be a big deal. But if we get sustained temperatures in the 40s, even some low 50s - coupled with over an inch of rain, that could be very bad for Minnesota's rivers."
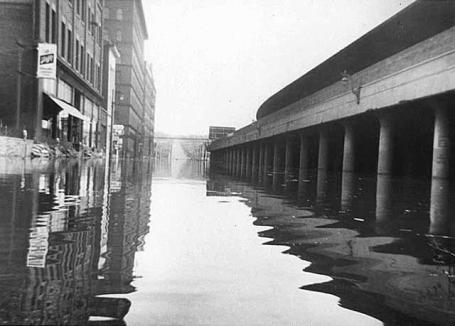
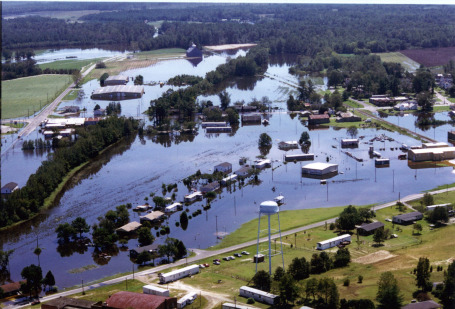
Kellogg Boulevard looking east during flood, St. Paul. 1965 Courtesy: Minnesota Historical Society "During April of 1965, the Mississippi, Minnesota, and St. Croix rivers reached record flood stages. Many of these records still stand today. Water flowed over the historic Lift Bridge in Stillwater as teenagers and convicts worked side-by-side to build a sand bag dike. Flood watching became popular in the Twin Cities. Mankato and Winona were especially hard hit."
Record-Weary. Both Luna and I marveled at what has transpired in just the last year:
2010 was the wettest year in Minnesota history. It brought the most tornadoes ever observed (as many as 113, more than 4 times our average number). And now we may be facing a Top 3 Winter for snowfall, coupled with a potentially historic flood season. September: wettest on record. December: snowiest on record. Every time we turn around we're setting records. Again, no one weather event, storm or season can be definitively linked to climate change. But warmer temperatures have evaporated more water from the world's oceans - the amount of water vapor floating overhead has increased by 4 or 5%. More moisture in the atmosphere over Minnesota may be tilting the odds in favor of more rain (and snow), and possibly more extreme severe weather events as well. It's too early to know for sure, but there's no question the last year has been historic by any measure.
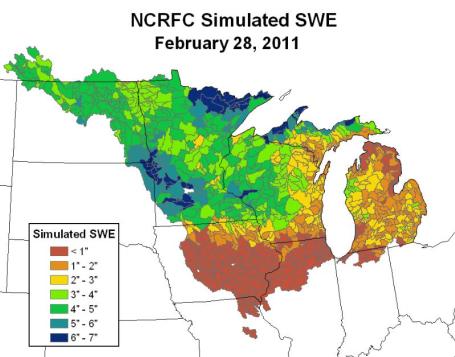
Convergence of Factors. The ground is not only frozen, it's waterlogged, saturated: soil moisture over much of Minnesota in the 99% percentile. As snow melts it will not be able to soak into the soil, but almost immediatly run off into streams and rivers. By some estimates there may be as much as 6-8" of liquid water locked up in the snow over southwestern Minnesota (see below). A worst case scenario for flooding? Possibly. One big wild card will be rain. If we can sneak through March without heavy rain storms, flooding will be severe, but possibly not quite reaching 1965 levels. On the other hand if we do pick up 1-2" of rain, accelerating snow melt statewide, the consequences on our rivers could be pretty bad. We're holding our breath and hoping for the best. If you live on (or near) a river, you should be doing more than holding your breath and crossing your fingers. Triple-check your flood insurance policy. Come up with a Flood Action Plan and make sure everyone in your family knows what to do. What (irreplaceable) family items/memories would you take with you? Tax documents, financial records. Have a plan now, and be pleasantly surprised if you never need to pull the trigger. The next 2-3 weeks will be critical in determining whether this is 1997-bad, or possibly 1965-bad.
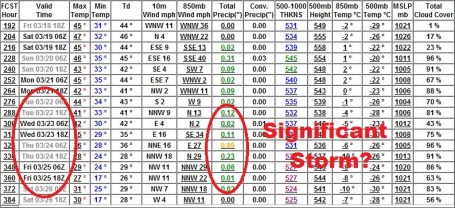
* I could see 3 days next week at or just above 50. The good news: no significant rain (or wet snow) is likely next week, the next chance of significant precipitation around March 23-24, way out on the horizon. The next
NWS Flood Outlook won't come out until March 24.
SWE. Snow Water Equivalent. Here's the latest from the NWS on how much water may be trapped in the snow pack, as much as 6-7" of water over southwestern Minnesota. Click
here for more flood resources from NOAA. A few highlights:
Minnesota River Basin
"
Winter precipitation has exceeded 200 percent of the mean across the entire Minnesota River basin. Winter temperatures have averaged 4 to 6 degrees below the mean. A week of warmer temperatures concurrent with the last outlook issuance ripened the snowpack and led to an average loss of an inch of modeled snow water equivalent across the basin. Subsequently, a significant winter storm that impacted a large portion of the Upper Midwest dropped an average of 1 to 2 inches of precipitation in the form of snow across the area. Current modeled snow water equivalents average between 4 and 6.5 inches across much of the Minnesota River basin. Streamflows remain well above normal and soil moisture conditions are extremely wet going into the spring."
NOAA on Facebook. Get the latest river updates direct from the North Central River Forecast Center (located in the Chanhassen office of the NWS)
here.
 Good Advice
. This last storm was a tough one. In this blog I try to share some of the model output, throw out the numbers the (raw) models are predicting, and people assume "that's Paul's prediction!" If you mention a range of 4-8", it's human nature for people to remember 8". I received this letter from fellow meteorologist, Tom Novak, who had some good advice, which I will take to heart. The models often ARE sensationalistic - the hard part of this whole business is showing what the trends are, without buying into the models, lock, stock and barrel. The goal all along has been to show the process, how we look at and assimilate the models and try to reach a logical conclusion. Throwing out inch amounts more than 2 days before a storm is a little like juggling hand grenades. You can do it for awhile, but in the end it may end badly (and blow up in your face). Thanks for the note, Tom.
Paul,
Don't beat yourself up in reference to your bouts with Mother Nature and computer models. Keep in mind, many of us are led astray by these number crunching machines. They can be your best friend one day and your worst enemy the next. My suggestion for you is to tone down the rhetoric when it comes to snow/rain totals. I feel that whenever a weather forecaster mentions totals, it is the ONLY thing that the public takes away from the broadcast/blog. Even if you preface your comments before hand with a word of caution, the public will STILL only remember the numbers you throw out there. That is why I rarely ever throw out numbers until approximately 48 hours before a storm. On the other hand, I do believe it is important to educate the viewer/reader AND to give them a heads up on weather patterns that are on our horizon, just don't try to get too specific. I believe you've been getting too specific lately when it comes to your extended forecasts. For instance, to mention that computer models are printing out 18" to 24" of snow over the next 3 weeks is absurd, even though it technically not your prediction. All in all, I love your work and I've enjoyed watching you work since the early 80s.
I hope this helps. Take Care.
Tom
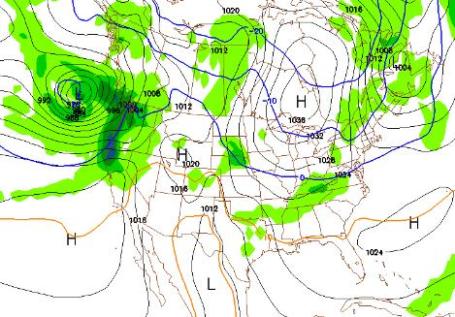
. In light of the busted forecast earlier this week, my mea culpa and the note from Tom (above) I am presenting the latest GFS model. There's no way to get specific this far out, but sometimes the models can indicate a trend (in this case a possible return of stormier, wetter weather after March 20-21). A big storm March 23-24? No idea (yet). Let's wait another week to 10 days and see if this is (another) fluke, or something real.
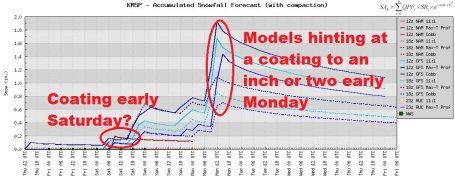
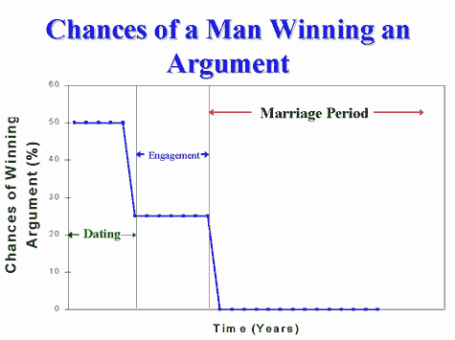
Anxious To Lose This Graphic (for at least 8 months). Man, am I sick of showing this graph - as effective as it can be from time to time. I'm as ready for spring as the next person, and it looks like we'll see a taste of early April next week. The arrival of warmer front may set off a period of slushy snow early Monday, a coating to an inch possible in some areas.
Tornado Expert Ranks Top Tornado Cities. Dr. Greg Forbes from the Weather Channel takes a look at major metropolitan areas that seem to see a disproportionate number of tornadoes. Oklahoma City makes the cut (no surprise there), along with Indianapolis, New Orleans, Atlanta and the Clearwater/Tampa market. An excerpt from a very interesting
article: "
The snows of the wicked winter are mostly gone. The winds of spring are blowing in and people are breaking out their shorts. They're wonderful signs that the seasons are changing. Those are also signs that tornado season is here. Almost more than any other phenomenon, tornadoes strike fear into the hearts of people everywhere. Tornadoes can strike anywhere at anytime. Unlike hurricanes, which are largely a coastal event, tornadoes can hit in the mountains, plains, coast, and even on islands. Some hold onto a myth that tornadoes don’t hit cities but this is false. Even parts of New York City got hit 3 times in 2010. We asked The Weather Channel's world-renowned Tornado Expert, Dr. Greg Forbes, to tell us which cities had the most tornadoes. He combed through the records, crunched the statistics, and what he found may surprise you."
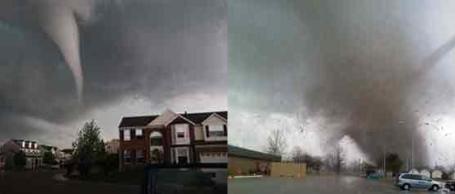
On Tornado Watch: Experts Predict Volatile Spring Season. La Nina winters are often followed by unusually severe tornado springs - a couple of recent papers point out this apparent correlation. It's hard to believe that Minnesota will experience anything close to last year's toll (the number may be updated to 113 confirmed touchdowns, just in Minnesota!) That said, looking at trends since the beginning of the year - I suspect it's going to be a very busy year for tornadoes nationwide. Here's an article that seems to confirm my suspicion from USA Today: "
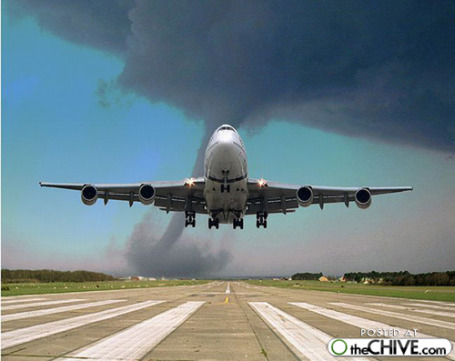
The USA is heading into the prime months for tornadoes, according to the National Weather Service. The private forecasting firm AccuWeather warns that this spring's tornado season will be more active than normal. AccuWeather meteorologist Paul Pastelok says areas of greatest concern lie from Arkansas and Missouri into Tennessee and Kentucky. "People are 10 times more likely to die in a mobile home than if the same tornado hit a regular home," says book co-author Kevin Simmons, an economist at Austin College in Sherman, Texas. Simmons says mobile homes constitute only 7% of the USA's housing stock, but his research found that 43% of all tornado deaths are to people in mobile homes, which can be no match for a tornado's violent winds, clocked as high as 300 mph." (ps: I strongly suspect the photo above was Photoshopped. Pilots rarely take off when a tornado is crossing the runway. Just a hunch).
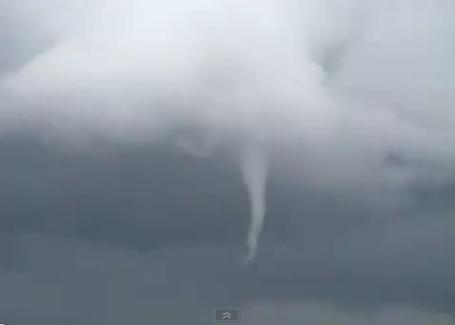 Tornadoes In Unlikely Places
. Check out this YouTube
video of a tornado spotted in the skies over Portugal. Tornadoes in Europe are rare, especially in early March.
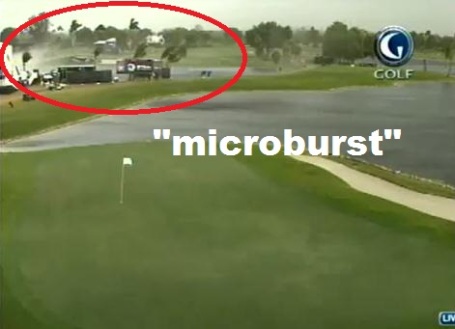
Microburst. A severe "microburst" (powerful, concentrated thunderstorm downdraft reaching the ground - spreading out into straight-line winds) hit the WGC Cadillac Golf Championship Thursday in Doral, Florida. They lost 2 cameras and 2 towers in less than 2 minutes - amazingly nobody was hurt. Check out this incredible YouTube
footage, courtesy of the Golf Channel.
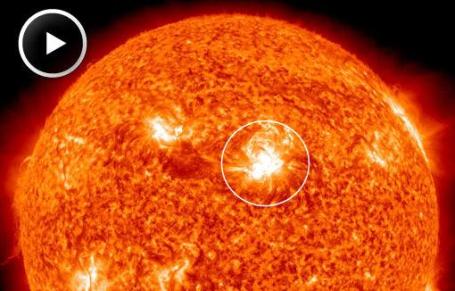
CME. Coronal Mass Ejection. Sounds painful, but that's just another word for a solar flare. Here's the
latest from spaceweather.com:
"
March 9th ended with a powerful solar flare. Earth-orbiting satellites detected an X1.5-class explosion from behemoth sunspot 1166 around 2323 UT. A movie from NASA's Solar Dynamics Observatory shows a bright flash of UV radiation plus some material being hurled away from the blast site. A first look at coronagraph images from NASA's STEREO-B spacecraft suggests that the explosion did propel a coronal mass ejection (CME) toward Earth. This conclusion is preliminary, however, so check back later for updates. After four years without any X-flares, the sun has produced two of the powerful blasts in less than one month: Feb. 15th and March 9th. This continues the recent trend of increasing solar activity, and shows that Solar Cycle 24 is heating up. NOAA forecasters estimate a 5% chance of more X-flares during the next 24 hours."
Appeal Of iPad2 Is A Matter Of Emotions. David Pogue from the NY Times has a
review of the new iPad2, and why it might make sense (for some) to upgrade. There's always newer/thinner/faster/better. What's frustrating in today's tech-world: the day you take your new, gleaming gadget out the door of your favorite store, it's already obsolete. Talk about a tech-treadmill: “
An utter disappointment and abysmal failure” (Orange County Design Blog). “Consumers seem genuinely baffled by why they might need it” (Businessweek). “Nothing more than a luxury bauble that will appeal to a few gadget freaks” (Bloomberg). “Insanely great it is not” (MarketWatch). “My god, am I underwhelmed” (Gizmodo). Good heavens! What a critical drubbing! Whatever it is must be a real turkey. What could it be? Only the fastest-selling gadget in the history of electronics: the AppleiPad. All right, let’s not pile onto the tech critics. The thing is, they were right, at least from a rational standpoint. The iPad was superfluous. It filled no obvious need. If you already had a touch-screen phone and a laptop, why on earth would you need an iPad? It did seem like just a big iPod Touch. But as it turns out, the iPad’s appeal is more emotional than rational. Once you get it in your hands, you get caught up in the fascination of manipulating on-screen objects by touching them. Apple sold 15 million iPads in nine months, created a mammoth new product category and started an industry of copycats. Apparently, it doesn’t pay to bet against Steve Jobs’s gut instinct."
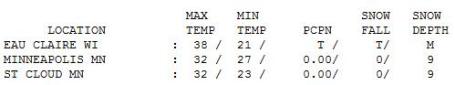
Murky Thursday. The sun didn't peek through until late in the day in the Twin Cities, keeping temperatures a few degrees coller than we though. Highs ranged from 24 at Redwood Falls to
32 in St. Cloud and the Twin Cities.
Paul's SC Times Outlook for St. Cloud and all of central Minnesota:
FRIDAY: Mostly cloudy and milder Winds: S 10-20. High: 39
FRIDAY NIGHT: Light mix changes to wet snow late, a little slush possible. Low: 27
SATURDAY: Slushy coating or dusting possible early, then windy and cooler with slow clearing. Winds: NW 15-30. High: 30
SATURDAY NIGHT: Clear to partly cloudy and cool (
don't forget to set your clocks ahead one hour before turning in). Low: 18
SUNDAY: Clouds increase, less wind. High: 36
MONDAY: Chance of a little wet snow, the turning breezy and milder. High: 41
TUESDAY: Snow going fast, shot at 50. Low: 34. High: 45
WEDNESDAY: Passing (rain) shower, April-like. Low: 33. High: 46
THURSDAY: Down to 2-3" dirty snow? Some sun. Low: 28. High: 42
Uncharted Waters
"Be prepared". I'm an (old) Eagle Scout; if it wasn't for weather merit badge I might have a real job right now. People living in (and near) the flood plain need to stay alert. At a recent St. Paul presentation to 500 emergency responders I got an update from Dan Luna, in charge of the local NWS office in Chanhassen. "I don't want to be accused of sensationalizing the threat, but in any given year there's a 3% risk of exceeding St. Paul's all-time flood stage, set in 1965. This year it's somewhere between 40 - 50%. That's higher than we've ever seen it before," he said. When? Luna and his staff of hydrologists are most concerned about late March into mid April. "A few days above 40 won't hurt us, but if we see sustained 40s, coupled with over an inch of rain, that could be very bad."
Luna is just as baffled by an uptick in crazy weather as I am. "Record wet 2010. Record number of tornadoes. We may come close to setting record snowfall, with near-record spring flooding." Even by Minnesota standards this is extraordinary.
40s arrive today, rain tonight ending as a slushy coating. Models print out 1-2" rain the latter half of March, 40s and a few 50s next week.
"Be prepared."
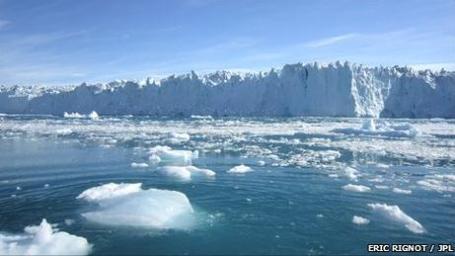
Polar Ice Loss Quickens, Raising Seas. Here's an
update from the BBC: "Ice loss from Antarctica and Greenland has accelerated over the last 20 years, research shows, and will soon become the biggest driver of sea level rise. From satellite data and climate models, scientists calculate that the two polar ice sheets are losing enough ice to raise sea levels by 1.3mm each year. Overall, sea levels are rising by about 3mm (0.12 inches) per year.
Writing in Geophysical Research Letters, the team says ice loss here is speeding up faster than models predict. They add their voices to several other studies that have concluded sea levels will rise faster than projected by the Intergovernmental Panel on Climate Change (IPCC) in its landmark 2007 assessment. By 2006, the Greenland and Antarctic sheets were losing a combined mass of 475Gt (gigatonnes - billion tonnes) of ice per year. On average, loss from the Greenland sheet is increasing by nearly 22Gt per year, while the much larger and colder Antarctic sheet is shedding an additional 14.5Gt each year.
Heat Damages Columbian Coffee, Raising Prices. People are already complaining about spiking gasoline prices. Just wait until the cost of your morning cup of Joe goes up. The reason? A warming trend in Columbia, as
reported by the New York Times: "TIMBÍO, Colombia — Like most of the small landowners in Colombia’s lush mountainous
Cauca region, Luis Garzón, 80, and his family have thrived for decades by supplying shade-grown,
rainforest-friendly Arabica
coffee for top foreign brands like Nespresso and Green Mountain. A sign in the center of a nearby town proclaims, “The coffee of Cauca is No. 1!” But in the last few years, coffee yields have plummeted here and in many of Latin America’s other premier coffee regions as a result of rising temperatures and more intense and unpredictable rains, phenomena that many scientists link partly to
global warming. Coffee plants require the right mix of temperature, rainfall and spells of dryness for beans to ripen properly and maintain their taste. Coffee pests thrive in the warmer, wetter weather. Bean production at the Garzóns’ farm is therefore down 70 percent from five years ago, leaving the family little money for clothing for toddlers and “thinking twice” about sending older children to college, said Mr. Garzon’s 44-year-old son, Albeiro, interviewed in a yellow stucco house decorated with coffee posters and madonnas.
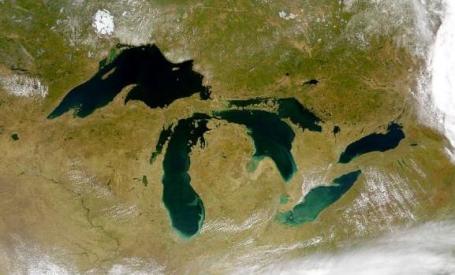
Climate Change Threatens Great Lakes. A
story from SFgate, from the San Franciscon Chronicle: "
In its latest report on Great Lakes water quality, the International Joint Commission — a collaboration between the U.S. and Canadian governments — identifies the re-emergence of eutrophication in the lakes as its chief concern. Eutrophication is unchecked plant growth caused by the presence of excessive nutrients, such as nitrates and phosphorous, in the water. Because that growth can deplete the amount of oxygen in the water, eutrophication poses a major threat to the quality and viability of the Great Lakes' massive water store."
Evidence Is Strong That Humans Are Causing Climate Change, Michigan Scientists Say. From Michigan's
mlive.com: Michigan's scientific community is speaking out against an attempt to keep the federal government from reducing the amount of carbon dioxide emitted from power plants and oil refineries. More than 150 university-based scientists and other researchers from Michigan have signed a letter to the state's congressional delegation asking the lawmakers to "stand up for clean air" and to not ignore the science of climate change. "We strongly urge you to reject any measure that would block or delay the U.S. Environmental Protection Agency from protecting the people of Michigan from air pollution and human caused climate change, both of which put public health, agriculture, the environment and our economy at risk," the leader reads.
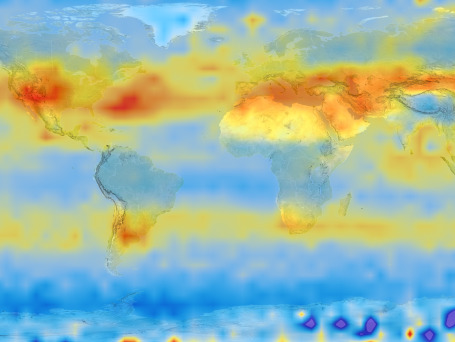
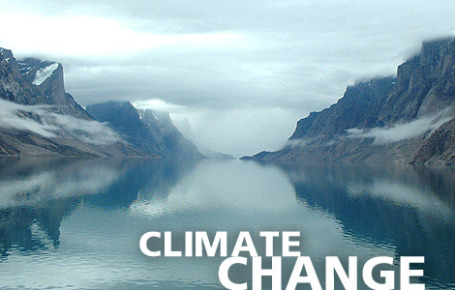
A Matter of Semantics: "Climate Change" vs. "Global Warming". Background global temperatures have warmed about 1.5 F. in recent decades - but 5-10 F. warming trends have been observed over far northern latitudes. This warming has resulted in transformations: thinning Arctic ice, shrinking glaciers, rising sea levels, less freshwater, and a possible uptick in extreme weather events, which can loosely be described as "climate change". Both expressions are different ways of talking about the same phenomenon. Here's an interesting
article from The Register, a newspaper in the U.K.: "
The likelihood of an average American agreeing that world temperatures are rising is strongly affected by the name used for the phenomenon. Americans believe strongly in "climate change", but acceptance that "global warming" is taking place is much less common. In a recent study carried out by psychologists in Michigan, 2,267 US adults were asked the following question, half of them hearing "climate change" and half "global warming": Some 74 per cent of those who heard "climate change" agreed that temperatures have indeed risen over the past century: only 68 per cent agreed if they heard "global warming". "Wording matters," says Jonathon Schuldt, lead trick-cyclist on the study. "Given these different associations and the partisan nature of this issue, climate change believers and skeptics might be expected to vary in their use of these terms."
* More on the survey (and apparent logic disconnect) in a Reuters story
here.
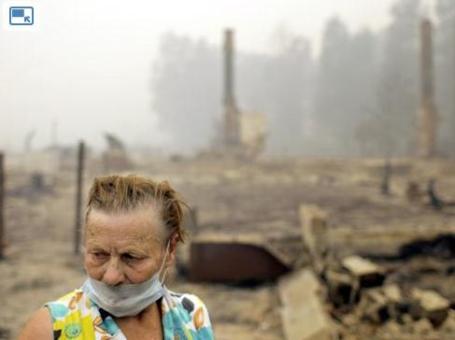
. Here's an excerpt from a
story at USA Today: "
WASHINGTON (AP) — Global warming was not directly to blame for last summer's deadly — and extraordinary — heat wave in Russia, researchers said in a report Wednesday that came with a climate warning. "We may be on the cusp of a period in which the probability of such events increases rapidly, due primarily to the influence of projected increases in greenhouse gas concentrations," said the team led by Randall Dole and Martin Hoerling of the U.S. National Oceanic and Atmospheric Administration. It was the warmest July since at least 1880 in western Russia. The heat wave led to an increase in deaths in the region, as well as drought, widespread fires, increased air pollution and severe crop damage. Also affected by the warming were Belarus, Ukraine and the Baltic nations. The extreme heat raised questions about links to global warming — the rising temperatures worldwide that most atmospheric scientists attribute to greenhouse gases being pumped into the air by industrial and other processes over the last century or so. The intense heat wave in Russia "was mainly due to natural internal atmospheric variability," the scientists reported in a paper to be published in Geophysical Research Letters."
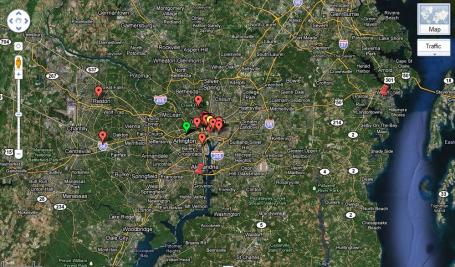
Tracking The Financial Backing Behind The Climate Denial Machine. "
Here’s a Google Map that shows the locations of the various thinktanks that do climate anti-science. While they often call themselves “institutes” if you zoom in, you may note that for some reason most of them are located within a block or so of K-Street. That must be just a coincidence."


No comments:
Post a Comment