+ 2.2 F. Believe it or not, April temperatures in St. Cloud are averaging just over 2 degrees F. warmer than average. Go figure!
.81" rain so far this month in the St. Cloud metro area (.63" less than average, as of April 21).
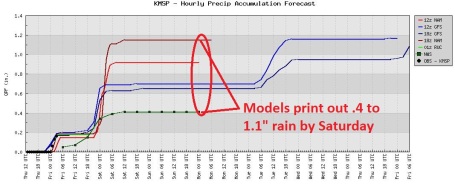
.44" rain predicted for St. Cloud by midday Saturday (NAM model).
48 F. high temperature Thursday at STC.
58 F. average high on April 21.
96 F. record high for April 21 in St. Cloud. (1980).
 A Stunted Spring
. So far Twin Cities residents have enjoyed only 6 days above 60 since March 1. Last year we saw 23 days above 60. The unpleasant details:
2010 (as of April 21)
Days above 60: 16
Days above 70: 6
Days above 80: 1
2011 (as of April 21)
Days above 60: 5
Days above 70: 1
Days above 80: 0
What a Difference a Year Makes. La Nina has kept us significantly cooler, but also (probably) helped to avert record flooding on Minnesota's rivers, and so far we've been able to avoid widespread severe outbreaks. Yes, you have to look long and hard, but there is a silver lining. (data for the Twin Cities).
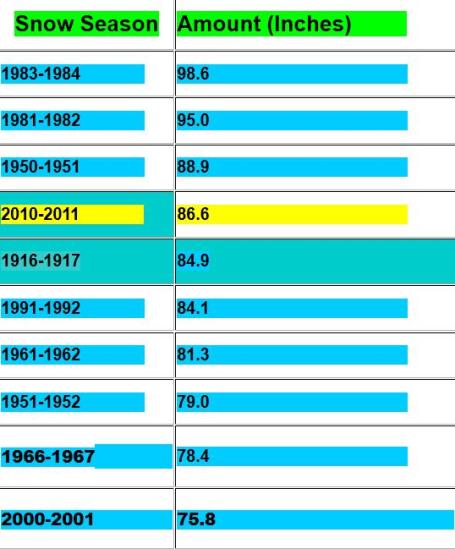 You Just Enjoyed/Endured The 4th Snowiest Winter On Record
. I
may regret saying this, but I think we've seen the last of the accumulating snow in the Twin Cities this "spring". I know, big mistake by putting that into print. We'll see. Here's an update from the Chanhassen office of the National Weather Service: "
2010-2011 Winter Currently Ranks 4th Snowiest of All Time for the Twin Cities
"Another 1.3 inches of snow was recorded at the Minneapolis/St. Paul International Airport on April 20th. This keeps the 2010-2011 winter season in 4th place on the all time snowiest winters list. The average seasonal snowfall in the Twin Cities is 55.9 inches. "
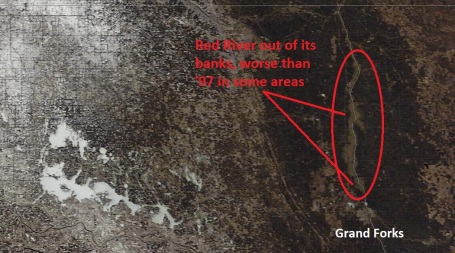
Worse Than '97? This NASA "Terra" 250 meter
satellite image (taken on April 11) shows extensive flooding downstream (north) of Grand Forks. According to MIC Dan Luna at the local Chanhassen office of the National Weather Service, overland flooding in parts of the Red River Valley the last 1-2 weeks has actually been worse than 1997.
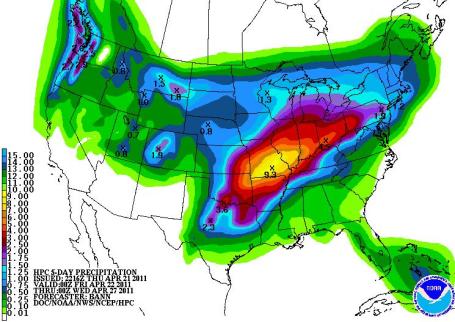
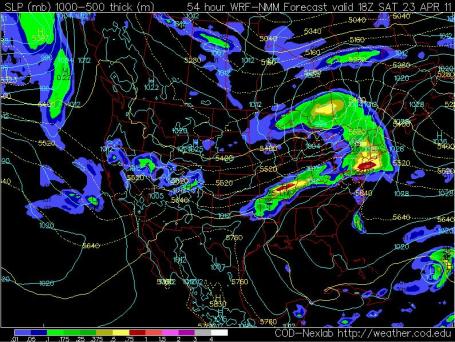
A Very Active Pattern. The latest QPF (quantitative precipitation forecast) prints out some excessive rainfall amounts over the central Plains and Middle Mississippi Valley, an 9+" bulls-eye over Missouri. While the heaviest rain bands should stay south of Minnesota (reflecting a trend we've seen since early March) some .5 to 1" rainfall amounts are possible close to home by Saturday morning.
*
National Weather Service Warns Of Excessive Weekend Rainfall, Worsening Floods In Mississippi, Missouri and Ohio River Valleys. An
update from NOAA: "
Forecasters with NOAA’s National Weather Service have begun alerting local communities, emergency management agencies and water managers of the strong possibility heavy rain that will cause significant flooding early next week to main rivers and tributaries in parts of the Mississippi, Missouri and Ohio valleys. Rainfall forecasts for many locations from the southern Great Lakes across the Midwest to southern Oklahoma and northern Texas are calling for 3-7 inches and possibly more. Much of that rain will fall on saturated soil that will absorb very little, if any, of the new water. Resultant runoff water will cause rapid rises and flash flooding as well as significant river and overland flooding in many areas. “Forecasters have determined there will be a very significant amount of precipitation falling in areas that don’t need any more rain at the moment,” said National Weather Service Central Region Director Lynn P. Maximuk. “River valley residents are accustomed to springtime floods, but this weekend those drainages will see torrential rain that will push flood levels well above normal stages. Our offices have already started advising local communities about the situation through NOAA Weather Radio broadcasts and agency web sites."
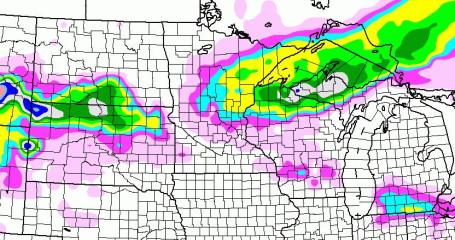
Puddle Potential. Hey, I'm happy not to be tracking slush, but actual rain showers. Kind of what you might expect by the last week of April. Good grief - what a "spring." Models print out anywhere from .4 to 1.1" rain by midday Saturday; I'm leaning toward the lower end of that spectrum, about a third of an inch. This will be more of a convective (showery) pattern, with big variations from town to town, but most of us will probably wind up with at least .25 to .50" of rain. Prediction: your lawn will be looking a lot greener by Sunday.
Soggy Saturday Blues? Although the bulk of the rain (and wet snow up north) will shift east by Saturday, residual (wrap-around) moisture, what meteorologists lovingly call "backlash" will linger on Saturday. Translation: low, scrappy clouds much of the day, a cool, damp breeze, a few sprinkles, drizzle, highs poking into the low 50s. Sunday still looks like the better day.
With Apologies. Yes, I have to include this, much as I'd like NOT to. Models are all hinting at a changeover to wet, slushy snow north of Mille Lacs late tonight and early Saturday. I could see a coating of slush into Brainerd, Little Falls and Taylors Falls, maybe 3-4" of snow for Duluth, as much as 6"+ over northern Wisconsin. Please avoid northern Wisconsin.
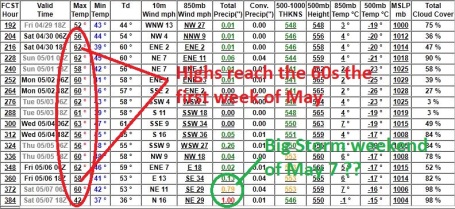
Spring In No Big Hurry. I keep waiting for the first surge of 70s and 80s - more than possible by late April. No such luck. Whether it's a lingering La Nina or other factors in play, the jet stream will be positioned 200-400 miles farther south than usual for much of the next 10 days, keeping slightly cooler-than-average air over Minnesota, where recent temperature trends have been more typical of early April The GFS shows highs reaching the 60s the first week of May, but that's about as mild as it's going to get through the first week of May.
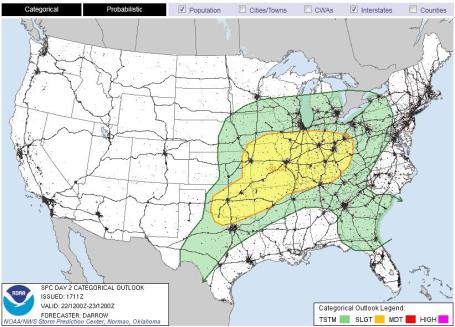 Friday Severe Storm Potential.
 SPC has a new (refined/colorful) graphical format for their predictions. Marginal instability may lead to a few (isolated) thundershowers today, in spite of cool temperatures at ground-level. The severe risk today extends into far southern Iowa, greatest from Oklahoma City and St. Louis to Indianapolis and Louisville. To see the severe outlook for the next few days click
here.
Strange Spring: Explaining This Year's Wild Weather. Emily Sohn from Discovery News has a
story about our wild spring, and what may be behind an apparent uptick in severe weather events. Is it La Nina, a symptom of climate change (more water vapor overhead), or just random chance? "
But La Niña, which is natural and cyclical, is not the only driver behind weird weather reports lately. For the last two years, for reasons climatologists do not yet understand, a strange pocket of warm air has lingered over the Arctic, Douglas said, making the dead of winter a full 10 to 20 degrees warmer than normal in Greenland and northern Canada. The bubble has displaced cold air southward. "If you leave the refrigerator door open, you warm up the refrigerator, and all that cool air kind of spills on to the floor," Douglas said. "That's what's happened." On top of all that, a general rise in global temperatures has boosted levels of water vapor in the atmosphere by four percent, Douglas said. That basically loads the dice for more storms to form. Meanwhile, Twitter and Facebook can accentuate and accelerate the sense that severe weather is worse than it is. As for what's to come, current weather patterns are poised to linger for a while longer. The atmosphere is energized, Douglas said, and jet stream winds are stronger than any other April he can remember. That means that volatility is guaranteed for the next 60 days. One meteorologist has predicted that another 300 more tornadoes will strike in the next two weeks. Whether that many pan out or not, Douglas expects this to be one of the top three tornado seasons on record."
Aftermath.
Here is an 11:00 YouTube clip showing raw video, the aftermath of a tornado that caused extensive damage at Shaw University, in Raleigh, North Carolina, hit hard by EF-2 and EF-3 strength tornadoes last Saturday. This video captures the confusion and chaos in the aftermath of a damaging wind storm.
What Happens When Two Tornadoes Collide? From a meteorological standpoint I'm not at all convinced that "two tornadoes can, in fact, combine." A tornado is the visible manifestation of a violent T-storm updraft. It's true that storms can converge, making them more intense/severe, but I can't recall an instance where "tornadoes merged" to produce a larger, more extreme tornado. There may be some confusion here - people mistaking "colliding tornadoes" with multi-vortex tornadoes, where as many as 5-7 smaller tornadoes all rotate around a common center. Some of these (massive) tornadoes can be 1/2 to as much as 2 miles wide, so big they have a small "eye". I know - bizarre. Here's an interesting
story from Slate: "
So why can't a pair of healthy tornadoes from different storms pull a Voltron? It's not unheard of for two distinct thunderstorm systems to slam together. As they approach each other, however, the updraft of air that sustains the smaller thunderstorm gets sucked into the larger storm. When that happens, the tornado associated with the smaller storm disappears; it's starved to death before it has a chance to join forces with the other twister. The most talked-about twin tornadoes were born in Kansas on March 13, 1990. After an F5-strength twister—the most intense kind, of which there have been 52 in U.S. history—passed through Hesston and began to weaken, the same thunderstorm that produced it generated a new tornado. Some observers described the twisters as combining into a single, more powerful funnel cloud, but most meteorologists don't think that's quite what happened. The two tornadoes did come into close proximity, they say, and their paths definitely overlapped. But that doesn't mean the two vortices joined up to create a single massive tornado. Instead, the dying tornado happened to peter out as it moved into the path of the growing tornado. The former probably had little or no effect on the latter. (You can find video footage of the Hesston double tornado on YouTube.)"
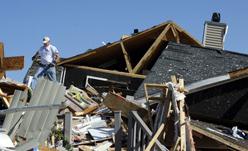
Making A Home Tornado-Proof Is Tough. Since 1953 57% of all insured weather-related losses in the USA have come from tornadoes, according to FEMA (a surprising statistic). Most homes are built to withstand winds of no more than 100 to 110 mph, but an EF-2 or EF-3 tornado can produce winds as high as 150-160 mph. Most homes don't have a chance. USA Today tackles an important subject - how do you lower the risk of severe damage from tornado winds that can exceed 150 mph? At those wind speeds even well-constructed brick/stone homes can be leveled. Here's an excerpt from the
story: "
The tornado had winds of 136 to 165 mph, according to the National Weather Service. Assaulted by winds of that speed, most homes in the USA don’t stand a chance, says Larry Tanner, a structural engineer at Texas Tech University’s Wind Engineering Research Center in Lubbock, who says that most are only built to withstand winds of 90 mph, which is at the low end of an EF1tornado....Assaulted by winds of that speed, most homes in the USA don’t stand a chance, says Larry Tanner, a structural engineer at Texas Tech University’s Wind Engineering Research Center in Lubbock, who says that most are only built to withstand winds of 90 mph, which is at the low end of an EF1tornado. “You’ll have extensive damage with an EF1, with top speeds of 110 mph,” says Tanner. “With an EF2 or EF3 tornado, you’re fighting an uphill battle.”...The destructive power of tornadoes, when compared with other weather catastrophes, is striking: According to the Federal Emergency Management Agency, since 1953, tornadoes (and related weather events) have caused an average of 57% of all U.S. insured catastrophic losses. Standard design building codes for homes across most of the USA simply aren’t meant for protection from tornadoes, reports Timothy Marshall, an engineer and meteorologist at Haag Engineering in Dallas. U.S. homes are designed to last 50 years, says Marshall, and the odds that a home will get hit by a tornado in that time are extremely low."
“Realistically speaking, it is not practical, much less reasonable, to build a tornado-proof house,” the report notes.
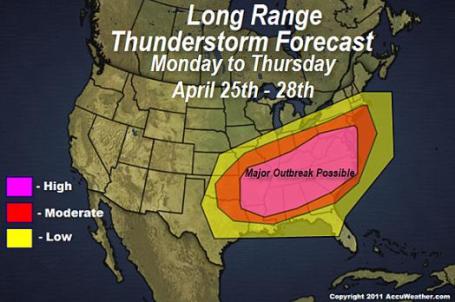
An "Insane Outbreak" Next Week? Henry Margusity from Accu Weather is
forecasting a major outbreak of tornadic storms again next week. All the ingredients are in place. We've already broken the April record for tornadoes (272 confirmed as of Thursday morning), and that number is bound to rise in the coming days: "
The weather has just gone insane with the pattern that is involving next week across the eastern half of the country. While I enjoy the meteorology of the events that will unfold, knowing that there is a potential for the loss of life in the pattern coming is not comforting to me. When I said that I expect up to 300 tornadoes in the next two weeks, I was not kidding. Given the pattern next week, I can see 100-200 tornadoes over a 4 day period starting Monday as I have outlined on the map below. There is no doubt that the ingredients for the severe weather outbreak will be inplace next week. We will have strong jet, plenty of heat and humidity and at least to potent storms. People living in the area that I am showing on the map should be aware of the extreme weather coming next week.
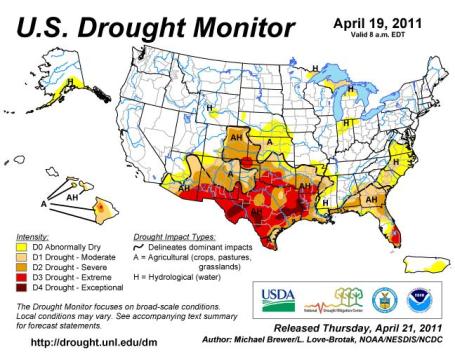
U.S. Drought Monitor. Roughly one third of the USA is experiencing drought conditions, and it's getting worse, especially across Texas. The latest information from NOAA is
here.
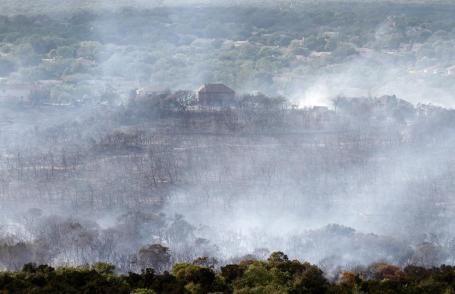 Texas Wildfire Update
. The Atlantic has an
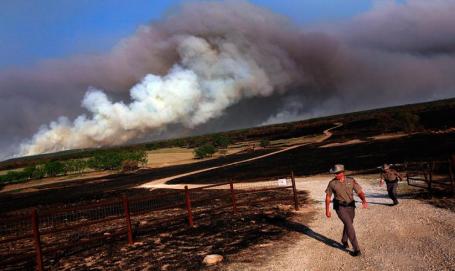
eye-opening story about the fires raging across much of Texas; well over a million acres of land have already burned - the combination of extreme drought, high winds, tinder-dry humidity and triple-digit temperatures have created a ripe environment for fires to spread. "
According to the Texas Forest Service, March 2011 was the state's driest March on record, leaving it in extreme drought and fueling recent wildfires that have destroyed hundreds of homes and burned more than one million acres over the past two weeks. High winds have been driving some fires eastward, closer to the densely populated Dallas-Fort Worth area. Governor Rick Perry has asked President Barack Obama for federal disaster funding, with the cost of fighting the fires estimated to be $2 million per day, supporting nearly 2,000 personnel across the state. Gathered here are recent images of the wildfires across Texas and the efforts being made to combat them. [30 photos]"
Caption For Photo Above: "Smoke billows from a wildfire that destroyed homes in southwest Austin, Texas on Sunday, April 17, 2011.
(AP Photo/Jack Plunkett)."
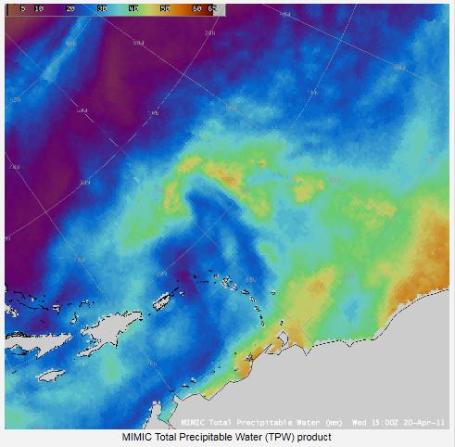
Heating Up In The Tropics. The University of Wisconsin (CIMSS)
blog takes a look at possible tropical or subtropical development in the Atlantic in the coming days. On paper hurricane season starts June 1 (when ocean water temperatures are generally warm enough to support tropical formation). But we may be getting off to an early start this year: "
The National Hurricane Center initiated Invest 91 to monitor the potential development of a subtropical or even possibly a tropical cyclone over the western Atlantic Ocean on 20 April 2011. AWIPS images of the MIMIC Total Precipitable Water (TPW) product (above; click image to play animation) showed that a tongue of moisture was being advected northward from the band of higher moisture along the Inter-Tropical Convergence Zone (ITCZ), and wrapped into the circulation of the developing disturbance."
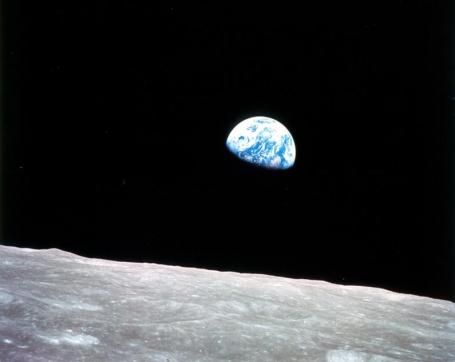 NASA Prepares Satellite For A New Era Of Earth Observation
. A
press release from NASA: "
On Christmas Eve in 1968, Apollo 8 astronauts orbiting the moon snapped an ethereal photo of our cloud-speckled blue planet rising over the lunar horizon with a hand-held camera. The photo, known as Earthrise, was one of the first views of Earth from deep space. It’s widely credited with helping spur the global environmental movement that began to find its voice with the first Earth Day celebration on April 22, 1970. More than four decades later, NASA’s view of Earth has grown far more sophisticated. Today, a fleet of satellites -- many of which are part of a project called the Earth Observing System (EOS) -- constantly monitor the oceans, land surfaces, and atmosphere."
The New York Times: Portrait Of An Old Media Giant In Transition. Gigaom.com has an
update on the NY Time's paywall: "
The New York Times Co. released financial results for its most recent quarter on Thursday morning. More than anything, they are a snapshot of a traditional media giant that is trying desperately to move into the digital future, but keeps getting dragged back down by the weight of its declining legacy businesses. The paper’s newly launched “metered access” pay plan has brought in 100,000 subscribers, and its online advertising revenue rose. But that was more than offset by a sharp drop in profits and a continuing decline in ad revenue. For the NYT, it seems to be one step forward and two steps backwards. Not surprisingly, the Times tried to focus on the good news: that about 100,000 people have signed up as a result of its subscription plan (although visitors and pageviews have fallen, according to some estimates). Although the news outlet didn’t give specific dollar figures, those subscriptions will likely produce about $20 million in annual revenue for the company — depending on how many of them signed up for the initial discounted offer of 99 cents a week. As Felix Salmon of Reuters noted, signing up 100,000 new subscribers puts the newspaper one-third of the way to its target for the year. So much for the good news. Unfortunately for the NYT, making $20 million in a year from its subscription plan is a drop in the financial bucket: the company’s operating costs for its News Media Group, which includes the New York Times and the Boston Globe, were $500 million for the first quarter alone. Even if the subscription plan hits its goal of 300,000 subscribers, it will only generate about $60 million in revenue, which is barely enough to move the needle for a company of the NYT’s size — and that’s not including the cost of implementing the wall in the first place."
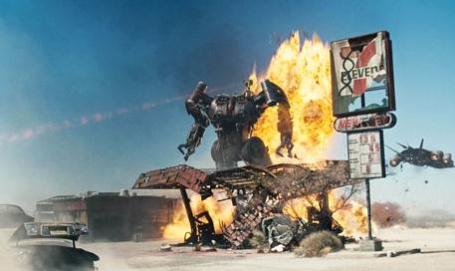 The Terminators: Drone Strikes Prompt Ministry Of Defense To Ponder Ethics Of Drone Strikes
. Ir you've seen any of the "Terminator" movies you might remember that April 21, 2011 was the day when The Machines were scheduled to rise up against their human inventors and leash all kinds of unspeakable problems on the planet. Didn't happen. This Guardian
article brings up a moral question: is it ethical to wage war via remote control? "
The growing use of unmanned aircraft in combat situations raises huge moral and legal issues, and threatens to make war more likely as armed robots take over from human beings, according to an internal study by the Ministry of Defense. The report warns of the dangers of an "incremental and involuntary journey towards a Terminator-like reality", referring to James Cameron's 1984 movie, in which humans are hunted by robotic killing machines. It says the pace of technological development is accelerating at such a rate that Britain must quickly establish a policy on what will constitute "acceptable machine behavior".
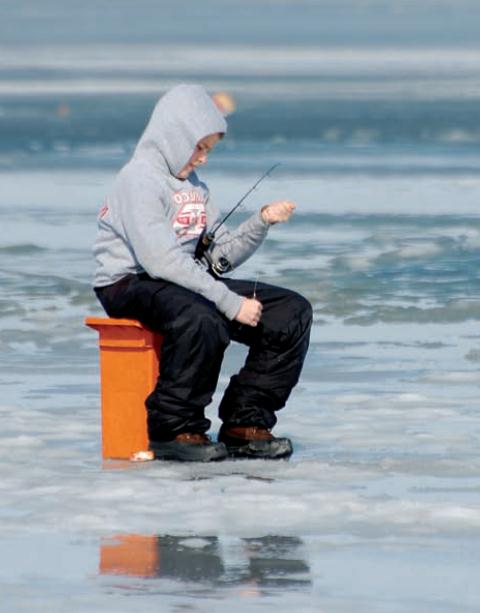
Fishing As A Contact Sport. I realize there is no such thing as a "bad day fishing". Any day out on the lake is a good day. But these poor guys fishing in Indiana are trying to avoid getting knocked out by flying silver carp - those nasty, invasive fish making their way up the Mississippi. For Minnesota fishermen it's no laughing matter. Check out this remarkable
YouTube video.
*
Carp Alarm Sounds. The Star Tribune has a
story about a 27 pound found in the St. Croix earlier this week. Not good: "
It's an ugly brute with a gaping mouth and eyes that hang low on its face. Someday soon, with two of its equally odious cousins, it could take over Minnesota's rivers and lakes, squeezing out native species. Unless somebody stops them. That's why the arrival of a 27-pound bighead carp in the St. Croix River on Monday triggered alarm among Department of Natural Resources officials, who fear the invasive carp could damage Minnesota's aquatic ecosystems and threaten its treasured walleyes and sunnies. Naturalists said that the lunker probably swam upstream from Iowa and that there's no sign the carp are reproducing in Minnesota."
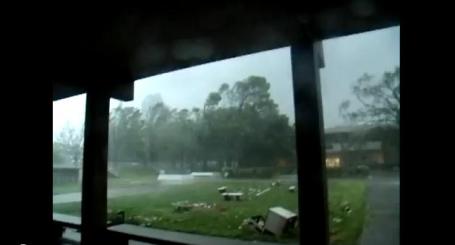
 Rain In The Air
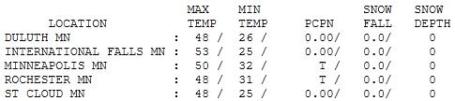
. After a sunny, promising start Thursday clouds increased during the afternoon - a cold rain spread across the area during the late afternoon and evening hours. Redwood Falls saw .28" rain as of 7 pm yesterday. Highs ranged from
48 at St. Cloud and Duluth to 50 in the Twin Cities and Redwood Falls.
 Paul's SC Times Outlook for the Twin Cities and all of Minnesota:
TODAY: Periods of rain, a few T-storms possible (not severe). Winds: E 10-15. High: 46
FRIDAY NIGHT: Rain lingers, heavy at times (mixes with snow north/east of Lake Mille Lacs, toward Brainerd and Duluth). A few flurries may mix in, especially north/east of St. Cloud. Low: 36
SATURDAY: Damp and cool. Clouds linger, few sprinkles. Winds: NW 10-15. High: 52
SATURDAY NIGHT: Partial clearing. Low: 37
SUNDAY: Nicer day, feels like spring again! Winds: SE 5-10. High: near 60
MONDAY: Clouds increase, late PM shower? High: 61
TUESDAY: Better chance of rain, especially far eastern MN and Wisconsin. Windy and raw. Low: 46. High: 51
WEDNESDAY: Partly sunny, drying out. Low: 39. High: 57
THURSDAY: Sun fades, few T-storms late? Low: 41. High: near 60

Happy To See Puddles
April showers bring May flowers (and isolated tornadoes). I'd like to go a week or 2 without slush or severe storms. Can we kick the Doppler and create a string of quiet, sun-drenched, 70-degree days? Probably not.
The pattern is as volatile as I've seen in recent years. La Nina winters are often followed by extra-severe springs; the atmosphere is energized, 100-150 mph. jet stream winds howling over the USA creating a ripe breeding ground & sufficient wind shear for tornadic storms. Already 272 confirmed tornadoes have touched down nationwide, a new April record.
Hey, I'm cheering on the warm fronts, but I also recognize that with the warmth will come a growing severe risk for Minnesota in the coming weeks.
A few thunderclaps may jolt you awake today; the NAM model printing out over 1" of rain by Saturday morning. Puddles here, but slush for Brainerd, maybe 3-4" at Duluth. Something for everyone. Sunday still looks like the nicer day of the weekend with enough sun for 60
Impact on river flooding? According to Dan Luna at the NWS we're not out of the woods until Memorial Day. "Trees, crops and vegetation soak up much of the water by June" he said. Fingers crossed.
Climategate: What Really Happened? (rated PG for salty language). Kate Sheppard from Mother Jones has an extensive article focused on the (staggering) amount of money funding climate-science-denial:
"IT'S DIFFICULT TO IMAGINE how a guy who spends most of his time looking at endless columns of temperature records became a "f***ing terrorist," "killer," or "one-world-government socialist." It's even harder when you meet Michael Mann, a balding 45-year-old climate scientist who speaks haltingly and has a habit of nervously clearing his throat. And when you realize that the reason for all the hostility is a 12-year-old chart, it seems more than a little surreal. Back in 1999, Mann—then a newly minted Ph.D. (PDF)—and a pair of colleagues constructed a chart that plotted historical climate data, spanning from 1000 to 1980. Because recorded temperatures only begin in the late 19th century, Mann and his team largely relied on so-called proxy records—measurements of tree rings, coral, and ice cores whose variations illustrate temperature changes over the years. The graph showed that after nearly 900 years of relatively stable temperatures, there was a sharp uptick starting in the 20th century. You may have seen a version of the graph, known as the "hockey stick," in the film An Inconvenient Truth—the temperature rise is so steep, Al Goreuses a mechanical ladder to reach the most recent temperatures. The graph was featured prominently in a seminal 2001 report from the United Nations' Intergovernmental Panel on Climate Change (IPCC) that concluded, for its first time, that "the balance of evidence suggests a discernible human influence on global climate." The film and the IPCC report made the chart famous, but Mann's version (PDF) appeared in the journal Geophysical Research Letters. There, he and his colleagues explained the complex methodology, and the uncertainties, involved in their study; but let's face it, phrases like "multiproxy data network" and "extensive cross-validation experiments" are lost on most of us. "This," Mann says with an upward swoop of the arm, "the public understands." The chart tells "a very simple story."
Politics And Self-Confidence Trump Education On Climate Change. Here's an interesting
article from arstechnica.com: "
This week saw the arrival of both a paper and a new survey which track the US public's awareness of climate change. The two use slightly different sources and come to slightly different conclusions, but there's one trend that trumps all: when it comes to climate change, politics dominates, eclipsing self-assessed knowledge and general education. In fact, it appears that your political persuasion might determine whether an education will make you more or less likely to believe the scientific community. One set of polls, conducted by the University of New Hampshire, focused on a set of rural areas, including Alaska, the Gulf Coast, and Appalachia. These probably don't reflect the US as a whole, but the pollsters had about 9,500 respondents. The second, published in the The Sociological Quarterly, took advantage of a decade's worth of Earth Day polls conducted by Gallup. These each had in the area of 1,000 participants, which the authors pooled. That provided a lot more to work with statistically, but ended up pooling data on a topic where the public's view is not fixed. In fact, the one timing analysis the authors performed showed that the gap between liberals and conservatives grew quite a bit larger over the last decade....
Both groups also come to similar conclusions about why this gap has developed. The piece in The Sociological Quarterly is appropriately sociological, suggesting that modernizing forces have compelled most societies to deal with the "negative consequences of industrial capitalism," such as pollution. Climate change, for these authors, is a case where the elites of conservative politics have convinced their followers to protect capitalism from any negative associations.
Unfortunately, neither group offers a satisfying solution. The sociologists simply warn that the culture wars have reached potentially dangerous proportions when it comes to climate science, while the group from New Hampshire suggests we might have to wait until an unambiguous consequence, like the loss of Arctic ice in the summer, for some segments of society to come around."
(My father raised me to believe that "actions have consequences". A lot of my friends on the ultra-conservative side of the political spectrum don't like to hear this. They are convinced that there is, in fact, a Free Lunch, and they (we) are entitled to it. An all-you-can-eat fossil fuel buffet, with no hangover. Right. They tell me that I'm somehow anti-business by believing the 97.4% of climate scientists who say this is a real problem. I point out the business opportunities emerging in this brave, new (green) world, that yes, it's a threat, but it's also the Mother Of All Business Opportunities. I've started 6 companies in Minnesota, and one of the new businesses, Smart Energy, is focused on making wind power more reliable, making wind farms and utilties more profitable. We're dumping 9 billion tons of carbon into the atmosphere every year, and yes, this has consequences. We can either deal with them in a logical, pro-business, pro-growth manner, or dump this in the laps of our kids - buy our wind turbines and solar panels from China in the years ahead).
. The
story from NPR: "
What went wrong? For months now, environmentalists have been asking themselves that question, and it's easy to see why. After Barack Obama vaulted into the White House in 2008, it really did look like the United States was, at long last, going to do something about global warming. Scientists were united on the causes and perils of climate change. Al Gore's An Inconvenient Truth had stoked public concern. Green groups in D.C. had rallied around a consensus solution — a cap-and-trade program for carbon emissions — and had garnered support from a few major companies like BP and Duke Energy. Both Obama and his opponent, John McCain, were on board. And, so, environmental advocates prepared a frontal assault on Congress. May as well order the victory confetti, right?"
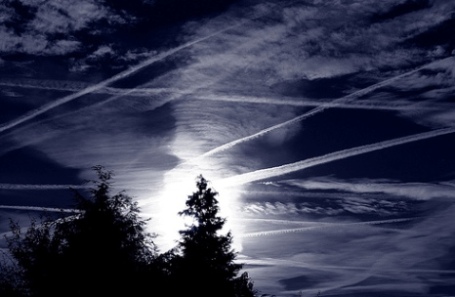
Global Radiative Forcing From Contrail Cirrus. Here's a little light reading for a Friday from
Nature. Bottom line: every day we inadvertently alter weather with jet contrails, which often spread out into a high, thin, veil of ice crystals, high clouds capable of keeping daytime temperatures a few degrees cooler, nighttime temperatures 1-3 degrees warmer: "
Aviation makes a significant contribution to anthropogenic climate forcing. The impacts arise from emissions of greenhouse gases, aerosols and nitrogen oxides, and from changes in cloudiness in the upper troposphere. An important but poorly understood component of this forcing is caused by ‘contrail cirrus’—a type of cloud that consist of young line-shaped contrails and the older irregularly shaped contrails that arise from them. Here we use a global climate model that captures the whole life cycle of these man-made clouds to simulate their global coverage, as well as the changes in natural cloudiness that they induce. We show that the radiative forcing associated with contrail cirrus as a whole is about nine times larger than that from line-shaped contrails alone. We also find that contrail cirrus cause a significant decrease in natural cloudiness, which partly offsets their warming effect. Nevertheless, net radiative forcing due to contrail cirrus remains the largest single radiative-forcing component associated with aviation. Our findings regarding global radiative forcing by contrail cirrus will allow their effects to be included in studies assessing the impacts of aviation on climate and appropriate mitigation options."
Energy And Environment: "Journal Of Choice For Climate Skeptics." Carbonbrief.org connects the dots with this
story: "
The list of '900+' papers linked to by the Global Warming Policy Foundation as supporting climate scepticism included more articles published in Energy and Environment than any other journal. We reported last week that nine out of the top 10 authors listed by the GWPF were linked to ExxonMobil. We also discovered that prominent scientists featured on the list didn't agree that their work supported skepticism about anthropogenic global warming - and had unsuccessfully asked for their work to be removed from similar lists in the past. We used the same data analysis tools to examine where the papers on the list were published. The most cited journal by a clear margin was Energy and Environment, which provided 131 papers to the list - almost 15 percent of the total. Energy and Environment's editor Sonja-Boehner Christiansen has said that she is "following [her] political agenda" in editing the journal, which is co-edited by Benny Peiser, director of the Global Warming Policy Foundation."
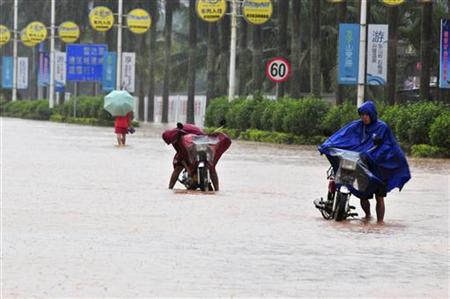
Rising Seal Levels Trigger Disasters In China - Xinhau. Here's an excerpt of an
article from Reuters: "
BEIJING, April 20 (Reuters) - Gradually rising sea levels caused by global warming over the past 30 years have contributed to a growing number of disasters along China's coast, state news agency Xinhua said on Wednesday.
Sea levels along China's coastline had risen 2.6 mm per year over the past three decades, Xinhua said, citing documents from the State Oceanic Administration. Average air and sea temperatures in coastal areas had risen about 0.4 and 0.2 degrees Celsius respectively over the past 10 years, the news agency added.
"As a 'gradual' marine disaster, the cumulative effect of rising sea levels could 'aggravate storm tides, coastal erosion, seawater invasion and other disasters'," Xinhua cited the oceanic administration as saying. An expert at the administration, Liu Kexiu, said the rising sea levels were a result of global warming. "Other key factors are land subsidence caused by human activities, including over-exploitation of groundwater and massive construction of high buildings in coastal areas," Liu said.


No comments:
Post a Comment