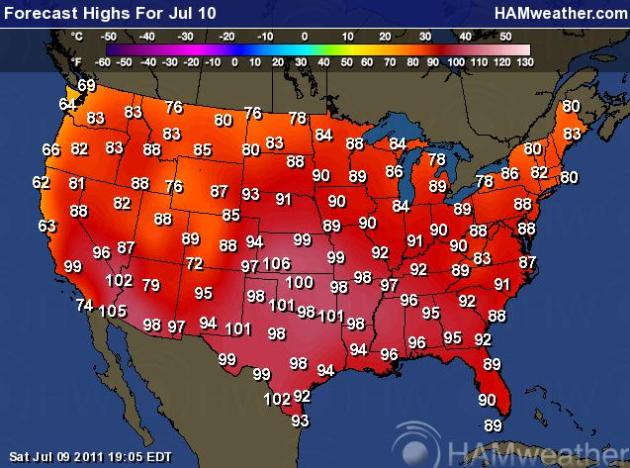
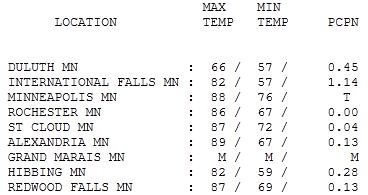
90-93 F. highs expected today with dew points rising into the mid 70s, Heat Index over 100 later today.

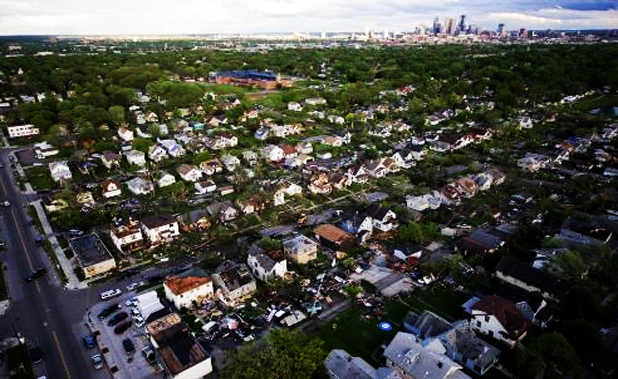
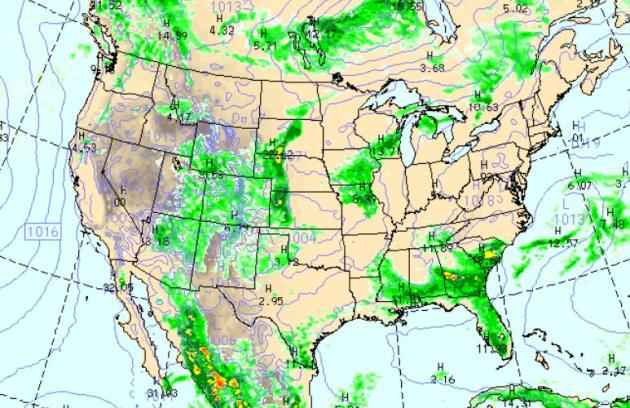
3.42" rain predicted for St. Cloud Sunday night (NAM model). Some 3-6" rainfall amounts are possible over central Minnesota - into the northern/western suburbs of the Twin Cities tonight - a potential for flash flooding overnight.
Slight severe storm risk later today and tonight.
Heatwave expands northward over the next 1-2 weeks, possibly the hottest weather of the summer. Minnesota will be on the northern fringe of the hottest weather, 100s likely as close as St. Louis, Chicago and Washington D.C.
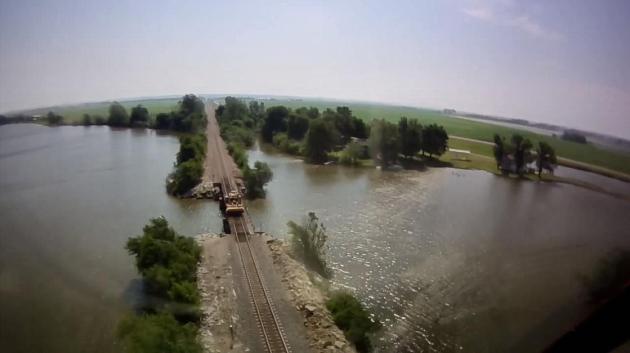
"....The Corps predicts that the (Missouri) River will eventually rise high enough to flow over some 18 to 70 levees, mostly in rural areas of southeast Nebraska, southwest Iowa and Missouri." - article on the potential for more levee failures below.

110 F. in Oklahoma City Saturday, a record for the day, and the hottest temperature at OKC since July, 1996.

Mind-Boggling. This was the scene at the Logan Pass Visitor Center at Glacier National Park late last week, still engulfed in 15-30 foot drifts.
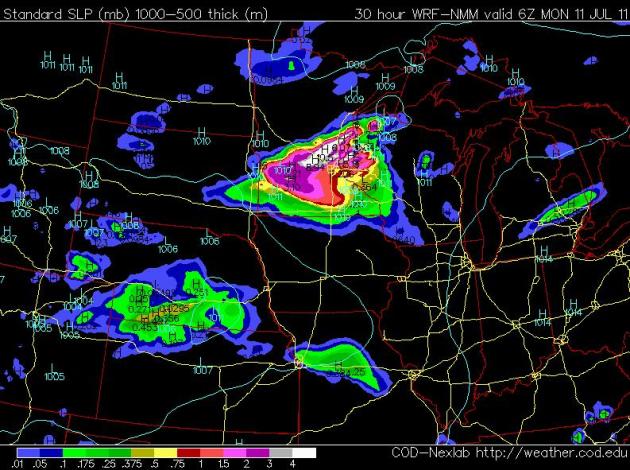
Flash Flood Potential? The NAM is printing out some excessive rainfall amounts over central Minnesota, just north/west of MSP tonight, as much as 8" in a few towns. That seems somewhat extreme to me, but with dew points in the mid to upper 70s and an advancing front capable of breaking the "cap" - I could see some torrential rains tonight, capable of flash flooding. A more realistic rainfall prediction is in the 2-4" range, with a few higher amounts possible. Stay tuned.
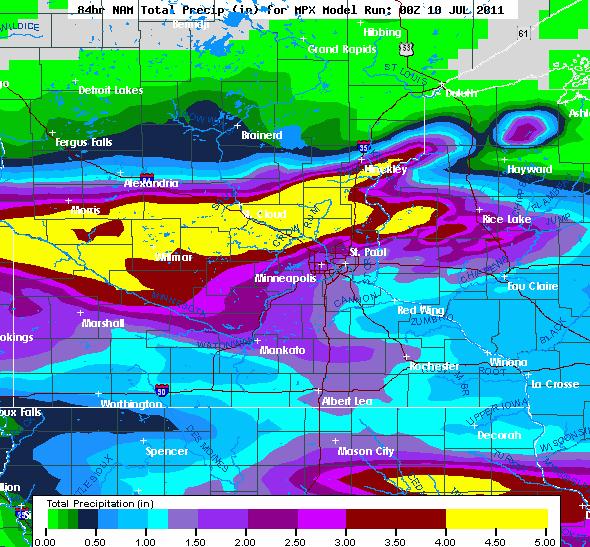
Why I'm concerned. The models have been fairly consistent predicting a major rainfall event tonight. The latest NAM/WRF prints out a band of 4"+ amounts from near Morris and Willmar into the St. Cloud area, the heaviest rains for the northern and western suburbs. I have a hunch the models are on the right track - it may be a VERY soggy AM commute on Monday.
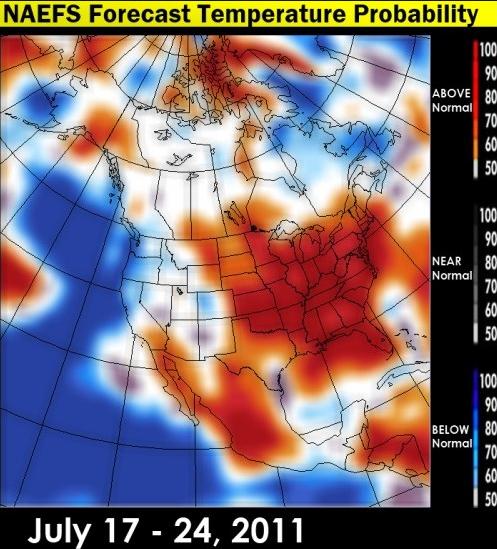
Hottest Air of 2011? The heatwave gripping the south is forecast to expand northward over the next 1-2 weeks - much of America will be enduring highs in the 90s and low 100s, more records will be broken, and heat-related injuries and deaths are probably inevitable. Meteorologist Larry Cosgrove opines on the building heat in his WEATHERAmerica post:
"There is a huge story brewing for the next 16 days, and that is heat. Several pulsations of the Sonoran heat ridge are forecast, with the worst of the hot weather across the Great Plains, Midwest, and Old South. Parts of the Northeast should escape the main brunt of the subtropical high. The western states, thanks to the monsoonal fetch and a mean 500MB trough anchored along the Pacific coastline, will likely see heat only across interior locations. The tropics are relatively quiet with the worst threats to the Caribbean Rim and Mexico after July 19."
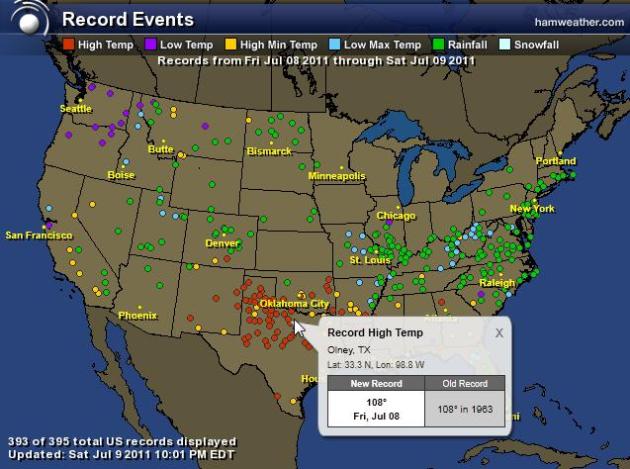
A Tale Of Two Nations. While residents of the northwest shiver through record chill, triple-digit heat continues to grip the southern USA, dozens of record highs set on Saturday from New Mexico to Georgia. Once again Texas has been hit the hardest, suffering through the worst drought since 1956. The green dots show record 24-hour rainfall reports. Click here to see an interactive map, courtesy of NOAA and Ham Weather.
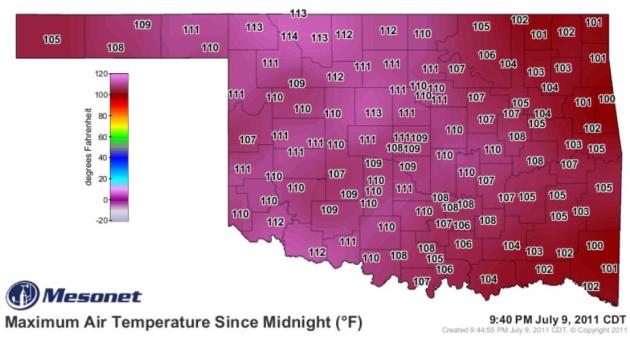
Oklahoma Sweats It Out. Every single reporting station was above 100 F. on Saturday, a number of stations over central and western Oklahoma in the 110-115 range. Map courtesy of the Oklahoma Mesonet.
Expanding Heatwave:
- Wichita, Kan.
- 100-degree days through July 8: 16
- Annual average: 14
- Most 100-degree days in a year: 50 in 1936
- Dallas, Texas
- 100-degree days through July 8: 14
- Annual average: 18
- Most 100-degree days in a year: 69 in 1980
- Oklahoma City, Okla.
- 100-degree days through July 8: 19
- Annual average: 10
- Friday was the 10th consecutive day with 100-degree temperatures
- Most 100-degree days in a year: 50 in 1980
- Austin, Texas (Camp Mabry)
- 100-degree days through July 8: 25
- Annual average: 12
- Most 100-degree days in a year: 69 in 1925
- June Information
- Record hottest June in Texas
- Second hottest June in Oklahoma and Louisiana.
- Record hottest June cities: Lubbock, Midland, San Angelo, Houston, Galveston, Wichita Falls, and Columbus, Ga.
- 42 all-time record highs were set across the country in June.
- Over 4000 daily record highs were tied or broken in June.
Meanwhile, at Glacier National Park, this was the scene at the Logan Pass Visitor Center on July 7:
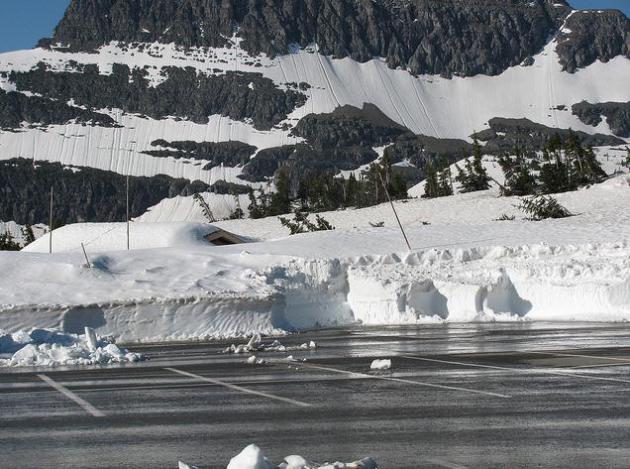
* I can't understand why there aren't any visitors yet...
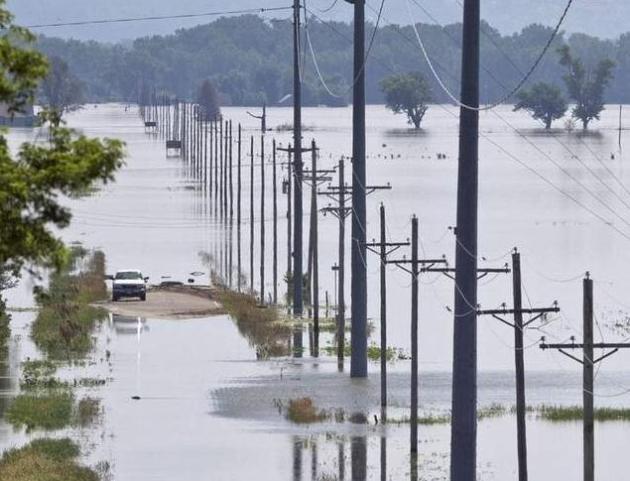
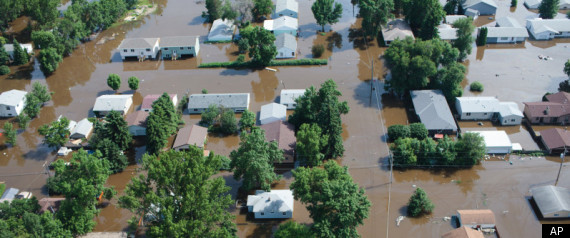
Army Corp Did Little To Tell Farmers About Floods, Vilsack Says. I don't think anyone was prepared for the scope (or duration) of this year's floods, a perfect storm of record snows out west (melting very rapidly) coupled with persistent, almost springlike storms over the Dakotas and Plains states lingering into June. The Des Moines Register reports:
"U.S. Agriculture Secretary Tom Vilsack chastised the U.S. Army of Corps of Engineers for its management of the now-flooded Missouri River, the Associated Press reported. In a June 28 letter to the Corps, Vilsack questioned whether the agency let enough water out of Missouri River reservoirs earlier this year. He also contended the agency has done little to communicate with farmers as the flood worsened. The Corps has said it adjusted flows for massive snowmelt upstream, but didn't expect the record rains on top of it this spring. On Friday, Vilsack's department declared six Iowa counties — Fremont, Harrison, Mills, Monona, Pottawattamie and Woodbury — as disaster areas. That will allow farmers to apply for federal aid. Farmers in neighboring counties — Cass, Cherokee, Crawford, Ida, Montgomery, Page, Plymouth and Shelby — may also get aid. Vilsack is the latest politician to question the Corps' handling of the situation, although most of the outcry has come from members of Congress, including members of the Iowa delegation, rather than Vilsack or other high-ranking administration officials."

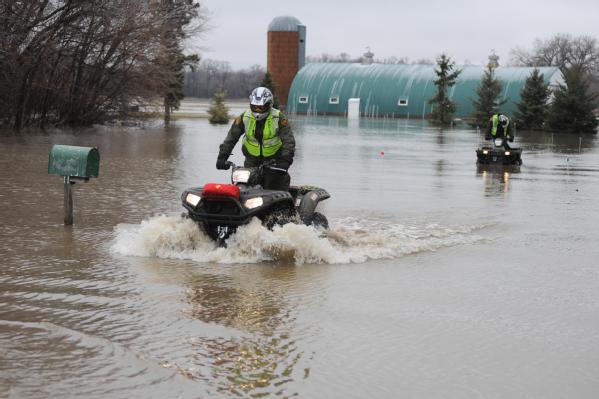
Exposure To Floodwaters Can Be A Health Risk. I guess this is fairly self-evident, but the Des Moines Register has some timely advice:
"LINCOLN, Neb. — Officials are warning people who live or work near flooded areas to be careful because floodwaters can carry diseases. Many low-lying areas along the Missouri River are covered with floodwaters, and the flooding is expected to continue at least into August. The Nebraska Emergency Management Agency's Earl Imler says it's important that people understand the risks floodwaters present. The federal Centers for Disease Control and Prevention says floodwaters can help transmit diseases such as cholera, hepatitis A and typhoid fever. So health officials urge people who come in contact with floodwaters to practice good hygiene and change into clean, dry footwear whenever possible.Also, children should be discouraged from playing in flooded areas, and any open wounds should be covered with a waterproof bandage before getting near floodwaters."
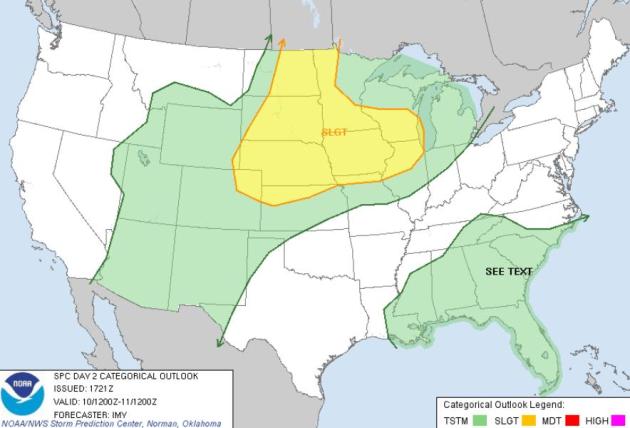
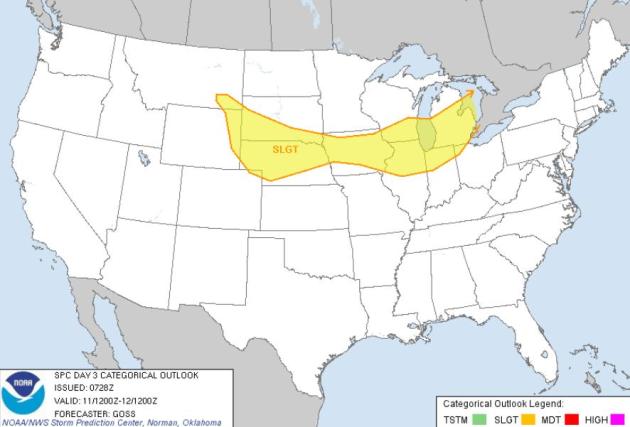
Back To Work With a Rumble. The risk of severe storms will linger tomorrow from Omaha and Des Moines eastward to the Chicagoland area, Milwaukee and Detroit - strong/severe storms firing along a nearly stationary front separating blast-furnace heat to the south from slightly more comfortable air and lower dew points to the north.
Experts Expect More Missouri River Levee Failures. The Argus Leader has the ominous news:
"OMAHA – Several hundred thousand acres of rich Midwestern farmland and even some urban areas near the Missouri River are at risk of flooding this summer during months of historically high water that experts fear will overwhelm some levees, especially older ones. Engineers who have studied past floods say the earthen levees in rural areas are at greater risk. “Most of the levees are agricultural levees. They’re not engineered. They’re just dirt piled up,” said David Rogers, an engineering professor at Missouri University of Science and Technology. So far, most levees have held along the 811 miles the Missouri travels from the last dam at Gavins Point in South Dakota to its confluence with the Mississippi River near St. Louis. The flooding thus far has covered more than 560,000 acres of mostly rural land, including nearly 447,000 acres of farmland. The water has forced some evacuations, but the extent of the damage to may not be clear until it recedes...The Corps predicts that the river will eventually rise high enough to flow over some 18 to 70 levees, mostly in rural areas of southeast Nebraska, southwest Iowa and Missouri. Other levees will become saturated, and water can erode their foundations, seep underneath or find other flaws to exploit."
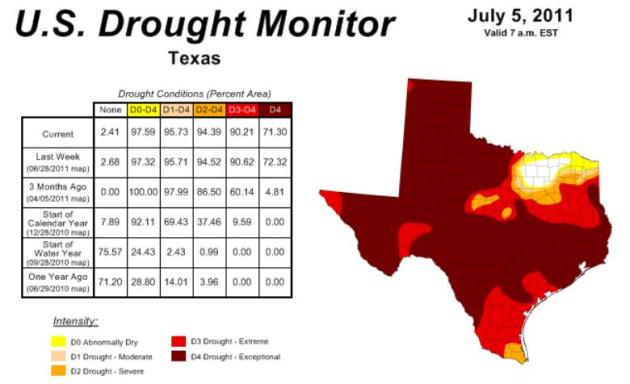
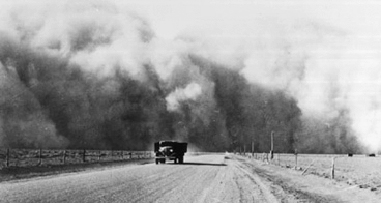
- At a drought conference in Austin yesterday, the Texas State Climatologist called the current drought the third worst on record for the state behind only 1956 & 1918. They are now 9 months into this drought.
- The massive exceptional drought area stretches from Arizona to South Carolina and Florida.
- That covers approximately 12% of the Lower 48, or around 367,000 square miles.
- This area is larger than the entire Northeast region of 15 states (Maine to Ohio to North Carolina) plus the District of Columbia.
- Since the Drought Monitor was first regularly produced in 2000, this is the largest coverage of exceptional drought.
- In Texas, the drought has made things "very difficult in lots of ways for wildlife," says Kirby Brown, an official with the Texas Wildlife Association. Even if they can find water, the animals may have trouble getting enough food, as trees and plants suffer from the lack of moisture. In West Texas, one of the areas of the state worst hit by the drought, local newspapers have reported animals creeping into cities in search of bugs that reside on lawns, and other nourishment. Wild turkeys are in trouble, Brown says. So are quail, and deer. It's fawning season for deer around the state, and they won't get much to eat. Deer hunters should also expect less spectacular antlers this year, when hunting season begins. Hunters will see the impact in September, when the Texas dove hunting season kicks off. Squirrel hunting in October will also be tough. Fish are in trouble, too. (http://www.chicagotribune.com/news/nationworld/kdaf-lengthy-drought-takes-toll-on-texas-wildlife-story,0,7178023.story)
- Several locations broke all-time high temperature records. On June 26, Amarillo, Texas, set an all-time high temperature record of 111 degrees F, breaking the record of 109 degrees F set just two days prior. On June 15, Tallahassee, Fla., also recorded an all-time high, 105 degrees F. For the month, 42 U.S. locations tied or broke all-time maximum high temperatures.
- The expansive heat across Texas resulted in an average temperature of 85.2 degrees F, which was 5.6 degrees F above normal, surpassing 1953 as the warmest June in 117 years of records. This was the fourth consecutive June in Texas with temperatures at least 2 degrees F above the long-term average."

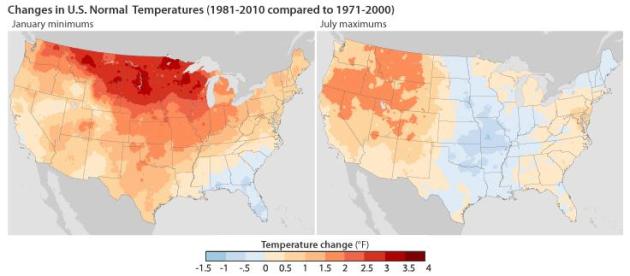
Defining normal
Gardeners, meteorologists, businesses, weather junkies and others will get answers to some of these questions in July, when NOAA’s National Climatic Data Center (NCDC) releases the latest version of an official weather product called the U.S. Climate Normals. Updated each decade, the U.S. Climate Normals are 30-year averages of many pieces of weather information collected from thousands of weather stations nationwide. Each time they are updated, an old decade is dropped, and a new one added. Starting in July, when you hear that a day was hotter, or colder, or rainier than normal, that ”normal” will be a little different from what it was in the past."

Up To 25% Of Accidents Associated With Gadgets. That's a vaguely distressing statistic, but it makes sense. I'm worried about the guy in front of me (texting), and the lady next to me flipping through her iPad during the morning commute. Mashable.com has more: "A new study from the Governors Highway Safety Association (GHSA) highlights the impact that cellphones and other gadgets can have on car crashes. According to the study, as many as 25% of U.S. car crashes are associated with drivers distracted by a cellphone or gadget. Produced using a grant from State Farm, the GHSA report, titled Distracted Driving: What Research Shows and What States Can Do [PDF] looks at the main external driver distractions. Not surprisingly, talking on cellphones, fiddling with gadgets and texting while driving are some of the most common driver distractions. After reading the 50-page document, it’s clear that this study contains as many certainties as uncertainties. As GHSA Executive Director Barbara Harsha says in a statement, “Much of the research is incomplete or contradictory. Clearly, more studies need to be done addressing both the scope of the problem and how to effectively address it.” Still, one certainty is that cellphone usage increases the risk of crashing and texting is likely more dangerous than using a cellphone."

Paul's SC Times Outlook for St. Cloud and all of central Minnesota:
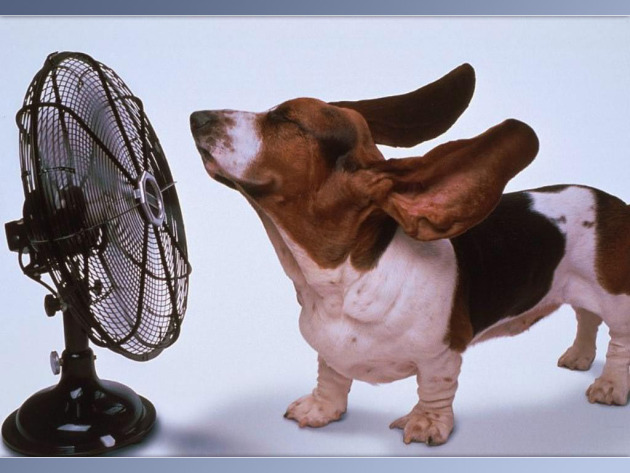
SUNDAY: Free sauna. Hot sun most of the day, very humid. A few severe PM storms, probably south/west of the metro area. Winds: S 10+ High: 92 (feels like 100+ by mid afternoon).
SUNDAY NIGHT: Heavy/severe storms likely, several inches of rain may fall, with a potential for flash flooding, especially over central Minnesota. Stay tuned for possible flood watches/warnings. Low: 73
MONDAY: Showers linger, some PM clearing - turning cooler. High: 87
TUESDAY: Storms south, sunshine north. Low: 64. High: near 80
WEDNESDAY: Unsettled & sticky, more T-storms likely. Low: 61. High: 79
THURSDAY: Muggy and warmer, more numerous T-storms. Low: 67. High: 85
FRIDAY: Dog days of summer come early, few T-storms possible. Low: 70. High: near 90
SATURDAY: Hot, steamy sun, isolated storm. Low: 72. High: 92
Stinking Hot!
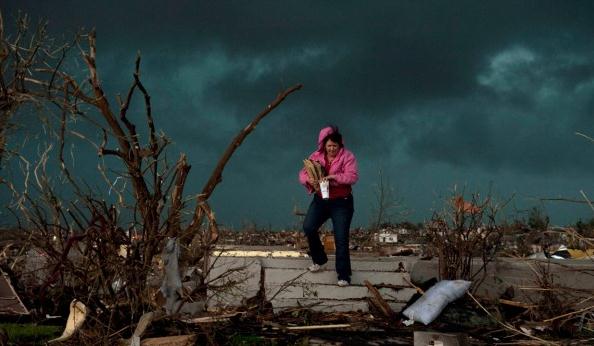
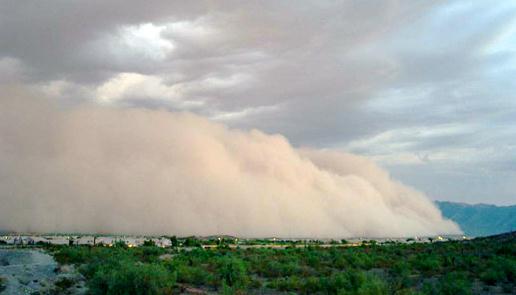
America's weather is on steroids: 100-degree heat expanding across the south (25 days above 100 in Austin). Tuesday a huge, Dubai-like "haboob", the largest ever observed (50-100 miles wide), swept into Phoenix, a 2 mile-high blizzard of sand & dust...the largest wildfires on record for Arizona & New Mexico..the largest area of exceptional drought ever observed across the south (12% of the lower 48 states), while March-like flooding on the Missouri River basin is forecast to linger all summer long, potentially worse than the previous high-water mark in '93. Last week the driest spot on Earth, the Atacama Desert in S. America, experienced a paralyzing snowstorm. Say what?
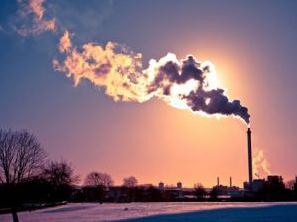
La Nina is gone. NOAA says these are all "unmistakable" signs of warming. We're seeing some of the results of dumping 95 million tons of greenhouse gases into the atmosphere every day, worldwide. "Global weirding" has arrived. Not sure I like the New Normal.
Another quick heat spike today results in 90-95 F. with a dew point surging into the mid 70s. It will feel like 100+ later, with a few severe storms tonight. I'm worried about the potential for flash flooding tonight across central Minnesota (some models print out 2-4" rain overnight). I could envision some serious flooding problems overnight - stay tuned. A stormy week is on tap as a front stalls to our south; temperatures cool off the first half of this week - more 90s by late week. We've seen 3 more 90-degree days than usual - more are on the way.

We're Responsible For It - Not Volcanoes. The Cumberland Times-News has a story explaining how volcanic eruptions can't explain the amount of atmospheric warming we've experienced in recent decades: "In last Sunday’s column, I mentioned some of the themes of the documentary, “Earth: An Operating Manual” by Richard Alley, a climate scientist at Penn State. Alley has diverse experience that give him a more objective perspective on climate change. Alley has done research across the globe from the polar regions to the Antarctic as well as having been employed by an oil company.
Alley sees the need to address both the growing increase of carbon dioxide in our air (causing to climate to change) and reducing our reliance on fossil fuels. Our global civilization is consuming fossil fuels at a rate that is a million times faster than the time it took to form these fossil fuels. The U.S. military knew about global warming in the 1940s from its development of heat-seeking missiles. These missiles had more difficulty in locating their targets as the whole atmosphere was warming up due to the absorption of heat by carbon dioxide (CO2) gas (that absorbs heat from the Earth’s surface and reemits it downward). From analysis of ice cores over the past 400,000 years, the global temperature rises and falls with the increase of CO2 in our atmosphere. The present CO2 concentration in our atmosphere is nearing 400 parts per million, compared to the previous highs of 280 parts per million. A key question that climate skeptics raise is: How can we be sure that humans are mainly responsible for global warming? Perhaps there are natural variations causing warming around the world? In regard to the increasing atmospheric concentration of CO2, consider the main natural source of CO2, volcanic eruptions. Our global civilization by its burning of fossil fuels emits 50 to 100 times as much CO2 as volcanoes. The CO2 emitted by volcanoes comes from the melting of rocks deep below the surface, which taps oxygen from the mineral oxides there. The observed drop in atmospheric oxygen levels is consistent with fossil fuel burning (carbon combines with oxygen molecules in air). There are three kinds of carbon atoms, Carbon–12, which plants tend to use, Carbon-13, somewhat rarer and radioactive Carbon-14, made from cosmic ray bombardment in our atmosphere. The content of the CO2 in our present atmosphere has a Carbon-12 concentration consistent with the burning of plant matter (fossil fuels)."
Alley sees the need to address both the growing increase of carbon dioxide in our air (causing to climate to change) and reducing our reliance on fossil fuels. Our global civilization is consuming fossil fuels at a rate that is a million times faster than the time it took to form these fossil fuels. The U.S. military knew about global warming in the 1940s from its development of heat-seeking missiles. These missiles had more difficulty in locating their targets as the whole atmosphere was warming up due to the absorption of heat by carbon dioxide (CO2) gas (that absorbs heat from the Earth’s surface and reemits it downward). From analysis of ice cores over the past 400,000 years, the global temperature rises and falls with the increase of CO2 in our atmosphere. The present CO2 concentration in our atmosphere is nearing 400 parts per million, compared to the previous highs of 280 parts per million. A key question that climate skeptics raise is: How can we be sure that humans are mainly responsible for global warming? Perhaps there are natural variations causing warming around the world? In regard to the increasing atmospheric concentration of CO2, consider the main natural source of CO2, volcanic eruptions. Our global civilization by its burning of fossil fuels emits 50 to 100 times as much CO2 as volcanoes. The CO2 emitted by volcanoes comes from the melting of rocks deep below the surface, which taps oxygen from the mineral oxides there. The observed drop in atmospheric oxygen levels is consistent with fossil fuel burning (carbon combines with oxygen molecules in air). There are three kinds of carbon atoms, Carbon–12, which plants tend to use, Carbon-13, somewhat rarer and radioactive Carbon-14, made from cosmic ray bombardment in our atmosphere. The content of the CO2 in our present atmosphere has a Carbon-12 concentration consistent with the burning of plant matter (fossil fuels)."
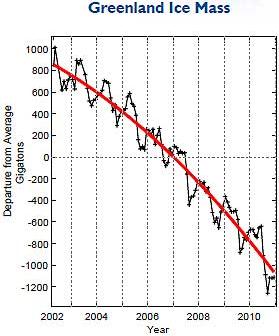
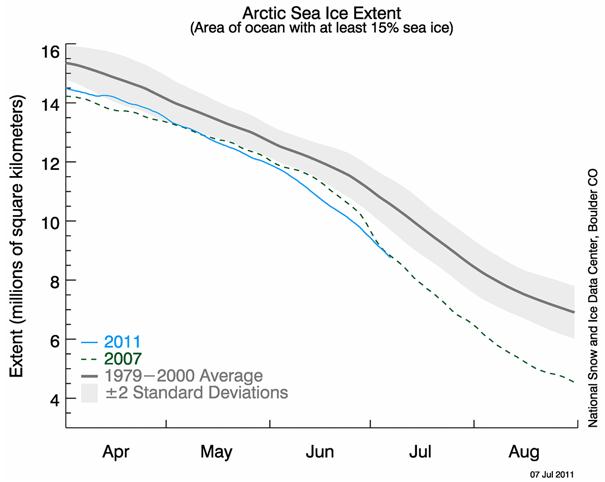
An Era Of Tornadoes: How Global Warming Causes Wild Winds. There is no clear-cut scientific link between climate change (warmer/wetter atmosphere) and tornado frequency or intensity, at least not yet. Here's one theory from The Atlantic: "For tornadoes, we have clear ideas on how they form and have some idea about how their strength may be linked to global warming. It's all about contrasts and gradients. Warmer temperatures over land surfaces create low-pressure systems (since hot air rises, creating "lows"), while cold fronts from the north come with high pressures. Weather "flows downhill," as it were—from highs to lows. When temperature and pressure gradients between highs and lows increase (as they do naturally in spring), the clash can twist to form tornadoes. The greater the contrasts, the greater the force of the twisters. This spring, especially warm and moisture-laden air from the Gulf of Mexico met up with especially cold fronts from the north, driven by melting Arctic and Greenland ice. (Between 2004-06 and 2007-09, the rate of ice mass loss in the Canadian Arctic Archipelago sped up threefold.) Warmer air and warmer seas are melting Arctic ice, and the shrinkage has changed North Polar air circulation—allowing "leakage" of cold air outside the Arctic Circle. Cold fronts previously contained within the polar vortex are now slipping out (driving severe winter weather in the U.S. and Europe in the past two years), and melting Arctic ice has also altered the path of the branches of the jet stream. Cold, fresh melt water from the Arctic has set up a blocking high-pressure area in the Atlantic off the Northeast for most of the past 18 months, altering the movement of weather fronts—sometimes hastening them, sometimes stalling them. "

A Response To Climate Change Denialism. Here's a post from the Scripps Institute of Oceanography: "Richard Somerville, a distinguished professor emeritus and research professor at Scripps Institution of Oceanography, UC San Diego, issued the following statement in response to a recent request to address claims recently made by climate change denialists:
2. The greenhouse effect is well understood. It is as real as gravity. The foundations of the science are more than 150 years old. Carbon dioxide in the atmosphere traps heat. We know carbon dioxide is increasing because we measure it. We know the increase is due to human activities like burning fossil fuels because we can analyze the chemical evidence for that.
3. Our climate predictions are coming true. Many observed climate changes, like rising sea level, are occurring at the high end of the predicted changes. Some changes, like melting sea ice, are happening faster than the anticipated worst case. Unless mankind takes strong steps to halt and reverse the rapid global increase of fossil fuel use and the other activities that cause climate change, and does so in a very few years, severe climate change is inevitable. Urgent action is needed if global warming is to be limited to moderate levels."
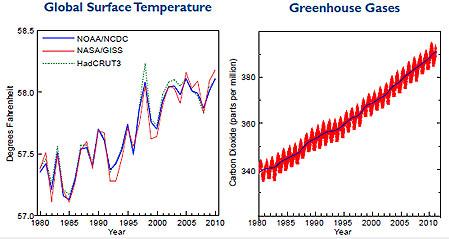
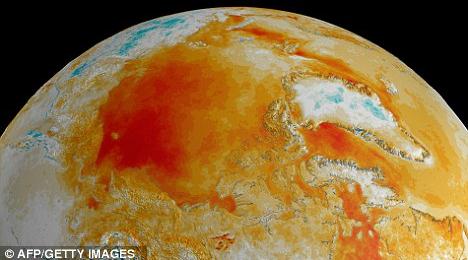
Graphic above: "Rising global surface temperatures (left panel), and CO2 concentration levels (right panel, from Mauna Loa observatory). NOAA and NASA temperatures in 2010 are virtually tied with 2005 for warmest year on record. The UK Hadley Center Research Unit's data shows 2010 second to 1998 for warmest year." Courtesy AMS & NOAA.
"Global warming will threaten Britain's security by triggering wars, food shortages and mass migration, Energy Minister Chris Huhne warned today. Although the UK may escape the worst physical impacts of rising temperatures and sea levels, the UK will still be exposed to 'alarming and shocking' consequences of climate change elsewhere, he said. The warning comes as Ministers are preparing a White Paper that will usher in a new wave of nuclear power stations and a massive expansion of wind farms to cut Britain's greenhouse gas emissions. In a speech to the Royal United Services think tank, Mr Huhne warned that climate change was a 'systemic threat' 'With luck, the UK may well escape the worst physical impacts,' he said. 'But in a connected world, we will be exposed to the global consequences. And they are both alarming and shocking.' The most recent report from the Intergovernmental Panel on Climate Change forecasts that world temperatures could rise between 1.1C and 6C this century, increasing sea levels by seven to 23 inches and making heat waves, droughts and floods more common."
No comments:
Post a Comment