21 F. average high on January 16.
28 F. high on January 16, 2015.
January 17, 1996: A severe ice storm hits the western and northern Twin Cities with accumulations between a half an inch and an inch. A foot of snow fell over central Minnesota.
January 17, 1982: The citizens of Tower wake up to a frigid low of -52 degrees F.
Embrace the Burn: Dangerous Wind Chills Today
"January, month of empty pockets! Let us endure this evil month, anxious as a theatrical producer's forehead" wrote French novelist Sidonie-Gabrielle Colette. Two frostbitten thumbs-up for Colette!
Look, if there was no January we might just take July for granted. Weather is a metaphor for life. Pain and suffering isn't optional. Power through the storms and bitter setbacks - there's always another warm front up ahead.
Right on schedule, a thaw is likely next weekend. 30s! I'm always amazed how good "freezing" feels after surviving a near-death subzero experience.
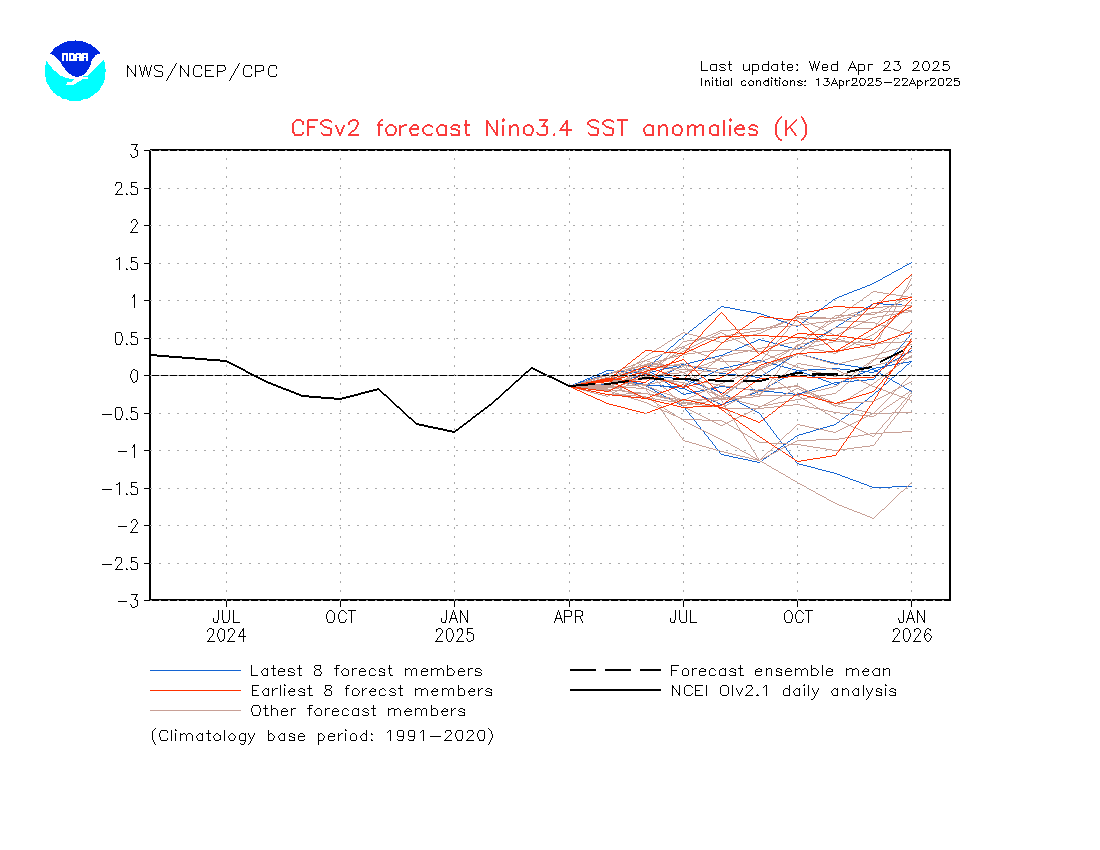
NOAA models pull El Nino-warmed 40s and even some rain into town by February 1. I'm skeptical it will get that mild and wet that fast, but my point is that a mild signal will return - sooner than you think.
Today? The coldest day of the year, with a chill factor as low as -35F. Exposed skin may become frostbitten in 10 minutes. Take it easy out there. ECMWF guidance keeps us below zero until 11 AM Tuesday.
Today we scrape bottom, with a unrepentant wind chill that may leave you anxiously trolling Expedia or Booking.com for a dirt-cheap airfare to...anywhere.
Map credit: "The typical number of winter days with low temperatures below those in Anchorage, Alaska, across the U.S." Credit: Brian Brettschneider
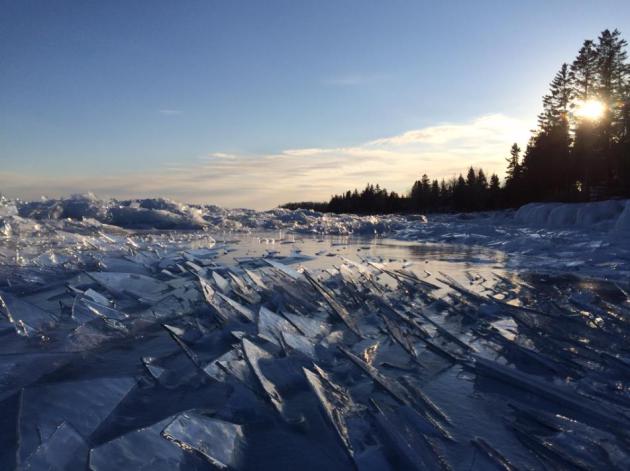
Photo credit: AerisWeather meteorologist Todd Nelson.
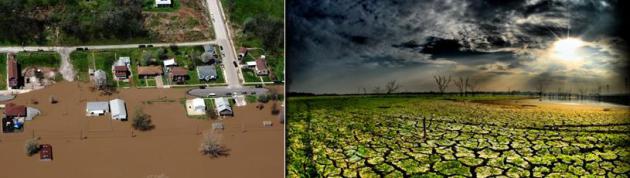
Flood Lessons From The Missouri Flood Event. Emergency Management has some good reminders in the wake of extreme December flooding on the Mississippi River; here's the intro: "This is one very informative article about flooding, damages, insurance and your options for disaster relief. It even brought up an issue I had not thought of before. Check out Some Flood Victims in Missouri Didn't Have Insurance; Some Didn't Have Enough. Here are some key points:
- Basic renters insurance doesn't cover flood damage. This is the one that was new to me -- just had not thought about it. The story alludes to the possibility of having it, but never saw it addressed before this article.
- Paid for? Might still need insurance! I wonder if a home is paid for if people also drop their fire insurance? I personally know three people whose homes have had significant fires. It can and does happen.
- Cost of flood insurance. If people think it is high, it is still not at market rates for the number of flood losses across the nation. Taxpayers in general are subsidizing their policies. Another form of entitlement program that people have gotten hooked on..."
Why Clean Energy is Now Expanding Even When Fossil Fuels Are Cheap. Here's a clip from a Washington Post analysis: "...Looking out still further, the International Energy Agency said last year that between now and 2020, renewable energy will be the largest area for growth, and predicts 700 gigawatts of added generating capacity. In other words, while half of new generating capacity in 2015 was in the clean energy space, in coming years we may see that percentage grow even higher. Granted, there is still a ways to go before wind, solar, and other renewable energy sources are dominant in generating our electricity. Wind and solar provide about 5 percent of U.S. electricity right now, for instance. Here as across much of the world, electricity generation is still largely dominated by fossil fuels..."
Photo credit above: "Solar panels are seen in the Palm Springs area, California, in this April 13, 2015 photo." Reuters/Lucy Nicholson.
- Wind and solar’s capacity share rises. The 122GW of wind and solar installed in 2015 made up about 50% of the net capacity added in all generation technologies (fossil fuel, nuclear and renewable) globally.
- No impact from low fossil fuel prices. Neither the 67% plunge in the oil price in the 18 months, nor continuing low prices for coal globally and natural gas in the US restrained the boom in clean energy investment....
Photo credit above: "
TODAY: Wind Chill Warning. Bitter sunlight, feels like -35F. Winds: NW 10-15. High: -5
SUNDAY NIGHT: Clear and numb. Low: -16
MONDAY: Bright sun, winds ease a bit. Chill factor still dipping to -25F. Winds: NW 7-12. High: -1
TUESDAY: Sunny start, shot of light snow late in the day. Wake-up: -9. High: 10
WEDNESDAY: Mostly cloudy skies, happy to be average. Wake-up: 8. High: 23
THURSDAY: Blue sky, no drama. Wake-up: 13. High: 20
FRIDAY: Partly sunny, milder breeze. Winds: S 10-15. Wake-up: 13. High: 26
SATURDAY: Ring the church bells! Welcome thaw with peeks of sun. Winds: S 10-15. Wake-up: 16. High: 33
Climate Stories...

Farmers Hold the Key to Climate Change Action in the United States. Turns out many of the farming practices that encourage resilience to drought and flood may also help to soak up excess CO2. Here's an excerpt of an interesting interview at Grist: "...But you do see more people in agriculture talking about it in different ways. Greg Page, chairman of Cargill, is talking about the business imperative of making some changes [see Grist’s story on Cargill and General Mills]. Just the other day Monsanto announced that it was pushing on its supply chain to create a carbon-neutral environment for the company. You have the retailers and food companies demanding changes in the carbon footprint as well, demanding changes in fertilizer practices. During cap and trade, Monsanto and all these major ag companies largely stayed back. They had statements on their websites about their concerns about climate change, but they were not politically engaged. Now here they are out there making public commitments. Hopefully, long-term, we’ll see these industry demands leading to some shift in the politics..." (Image credit: Shutterstock).
Influence of Climate Change on Record U.K. December Rains. El Nino was a factor, but it may have been dwarfed by a warmer, wetter climate. Here's an excerpt from climateprediction.net: "Applying three independent methodologies of extreme event attribution, we show that temperatures and precipitation in the UK in December 2015 were extremely unlikely even in a warming world with observed SST patterns, including El Niño, as an additional driver. This indicates that random weather noise played a very large role in December’s weather. At the same time, the event was much less likely in the representations of a climate without human influence, showing that climate change greatly affected the odds of such a month occurring. The observed temperature anomaly is so far outside the expected distribution that the odds are difficult to determine. We find that anthropogenic climate change approximately doubled the occurrence probability of the event for lower return times..."
Republican Presidential Field Tilts Rightward on Climate Change. Here's a clip from a Wall Street Journal article: "...Shifts by Mr. Rubio and some of his rivals on the issue recall an inconvenient past that many in the GOP would like to forget: Republicans, not Democrats, first championed market-based systems to control pollution, as a way to avoid more direct regulation. Until 2008, many Republicans, including then-presidential nominee John McCain, supported cap-and-trade to address climate change. Once Mr. Obama won the White House, Republicans swiftly unified against nearly all of his initiatives, including a cap-and-trade bill that would have set limits on carbon emissions and allowed companies to trade pollution credits to comply..."
How Scientists Link Extreme Weather to Climate Change. I'm
fascinated by attribution studies, which is still emerging science. How
is a warmer (in many cases wetter) atmosphere increasing the
probability of specific events? Here's an excerpt of a good explainer at
Carbon Brief: "...Human
influence is making some events much more likely, others a bit more
likely, and still others less likely. It is very important we don’t just
focus on the events that have been made much more likely, because a
small increase in the risk of very high-impact events could be just as
important or more so. Eventually, we may start to see events that simply
could not have occurred at all in the absence of human influence on
climate, so I guess for such an event one would have to say it was made
infinitely more likely to occur. But for most of the short-duration,
localised events that most people think of as weather, that point is a
very long way off indeed..."
A Visual Forecast for the End of the Century. I found this interesting, courtesy of Climate Central and Scientific American: "...Multiple factors likely contributed to the recent warmth, including the effects of El Niño, and the unusually strong polar vortex. However, the science points to global warming
as the primary cause which, if left unchecked, will cause a steady rise
in temperature in for decades, at least, and maybe more . The graphic
below from Climate Central looks ahead to see where this trend might take the U.S. by 2100..."
Climate Change Called Top Risk for Economy.
Because it flavors many other troubling trends and hot-spots. The
military calls it a "threat multiplier", impacting water supplies, where
crops can be grown, migration patterns - the list goes on. Here's an
excerpt from TribLIVE: "...That's
the first time that an environmental concern has topped the list of
global risks of the WEF's Global Risks Report and comes after what
meteorologists say was the hottest year on record. “Climate change is
exacerbating more risks than ever before in terms of water crises, food
shortages, constrained economic growth, weaker social cohesion and
increased security risks,” said Cecilia Reyes, chief risk officer at
Zurich Insurance, which helped develop the annual Global Risks Report.
The survey of nearly 750 experts and decision-makers from a variety of
fields, locations and ages was conducted in the autumn of 2015 before
the global warming targets agreed upon in Paris in December..."
Image credit above: "The MetOp-B satellite, one of many that use microwaves to measure the Earth's temperature." Drawing by ESA/Eumetsat.
No comments:
Post a Comment