66 F. high temperature Sunday in St. Cloud.
69 F. average high on May 15.
63 F. maximum temperature at KSTC on May 15, 2015.
May 16, 1934:
An extreme hot spell results in temperatures over 100 across parts of
Minnesota, and record highs of 94 in St. Cloud and Minneapolis.
A Week That Restores Your Faith in a Minnesota MayWeather
is an apt metaphor for life: storms of unhappiness, squalls of bad
news; careening around puddles of misfortune. And then the sun comes
out, birds begin to chirp, and you remember how good it is to be alive.
This week will be one of those happy chapters.
One last swirl of
cold air aloft sparks a few afternoon showers; otherwise I see a dry
week with slowly warming temperatures. Expect 70s the latter half of the
week; sticky 80s possibl
e Sunday an
d Monday. In little over a week we will go from complaining about wind chill to whining about bugs & humidity. Wait for it.
ECMWF
models hint at a few severe T-storms early next week, but it's
remarkable how quiet it's been here; fewer hail and tornado-producing
storms than usual. June is, historically, the wettest, most severe month
of the year in Minnesota - so it's premature to let our guard down yet.
Meanwhile
flood-weary residents of Texas and the Gulf Coast get doused again this
week. And April was the 7th month in a row of "hottest months"
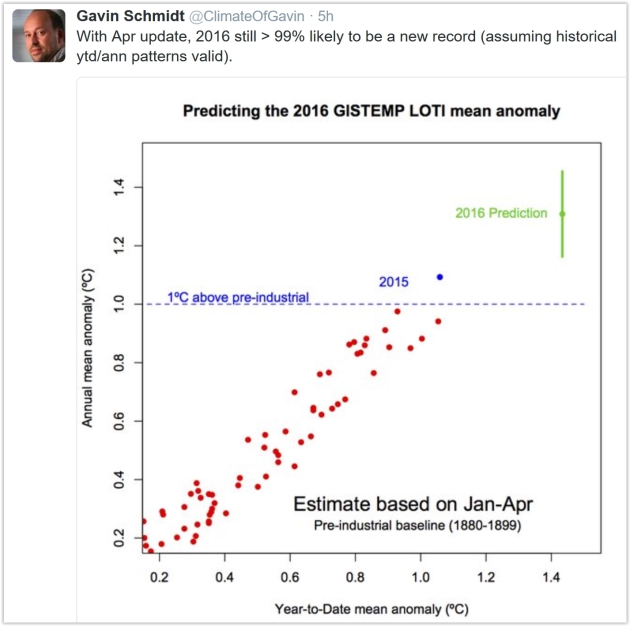
worldwide; 2016 on track to be the warmest year on record.
Another coincidence.
Instability Showers Today.
A steep lapse rate (temperatures falling more rapidly with altitude
than normal) may spark a few pop-up showers today; a thundershower can't
be ruled out but conditions aren't ripe for anything severe. Today may
bring the only chance of rain for the next 6 days. Future Radar: NOAA's 4
KM NAM model and AerisWeather.
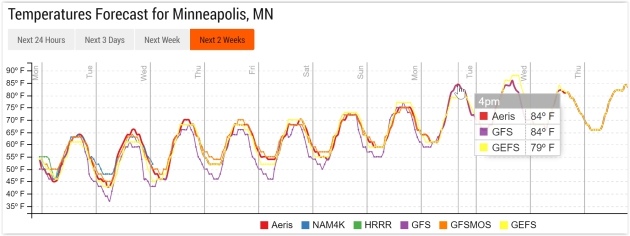
Upward and Onward.
All the models are in alignment and agreement, showing a steady warming
trend into next week, with 70s likely late week and over the weekend.
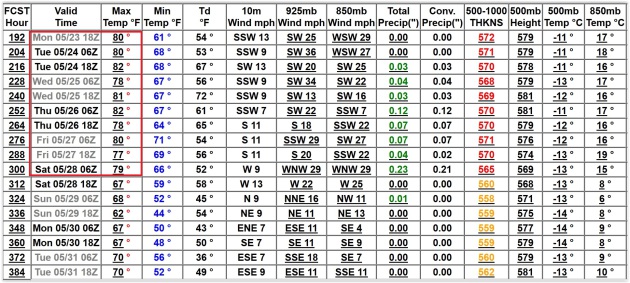
Taste of Summer Next Week?
GFS guidance from NOAA shows fairly consistent 80s next week with dew
points rising above 70F by the middle of next week, sparking a few
T-storms. We're overdue for severe storms - I wouldn't be surprised to
see a few watches and warnings within 7-9 days.
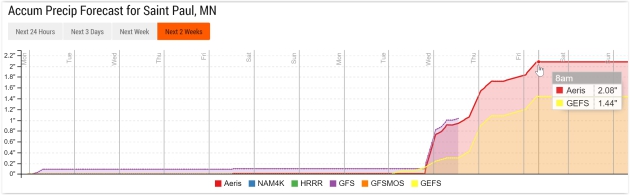
A Dry Week - Stormy Weather Returns Next Week.
With the exception of a few instability showers today a dry sky
prevails into Sunday, but models print out 1-2" rain the latter half of
next week. Graphic: Aeris Enterprise.
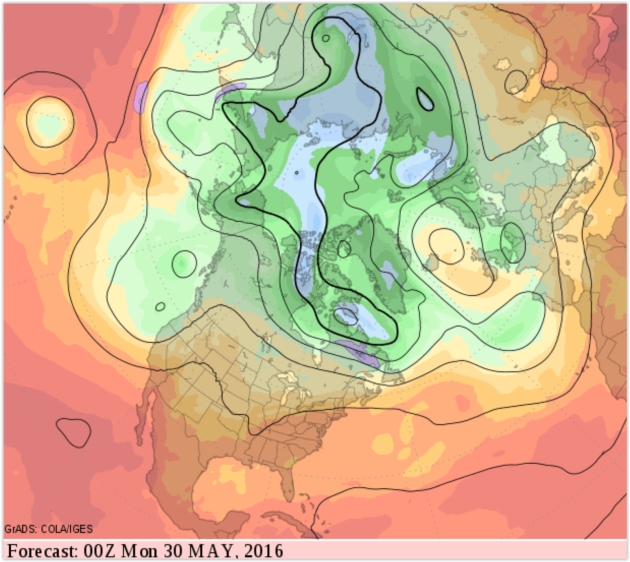
Lukewarm End to May.
I don't see any extended heatwaves, no record warmth brewing (yet) but
GFS predictions for 500 mb winds the end of May suggest temperatures a
few degrees above average as we transition into a more summerlike
pattern.
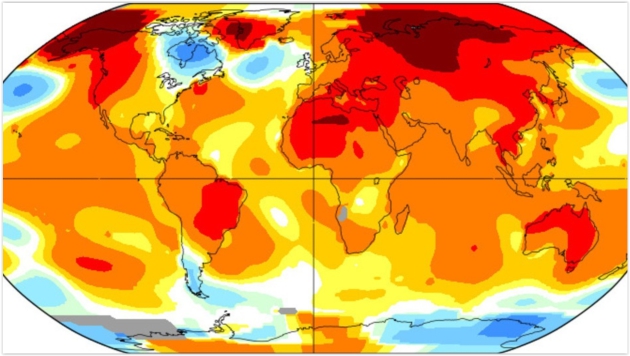
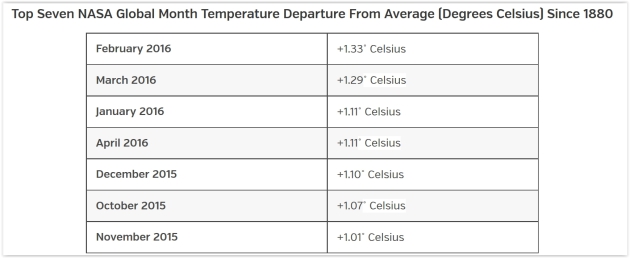
Seven In A Row: April is the Hottest April on Record - a 7,000 Year Record? Details via
HotWhopper: "...
This is the seventh month in a row
of "hottest months", all of which had an anomaly more than one degree
Celsius above the 1951-1980 mean. This breaks the previous record of six
in a row, set last month. This hasn't happened before in the record
since at least the 1950s. Earlier times probably aren't sufficiently
accurate on a month by month basis to say. I didn't check back that far
and, in any case, pre-1950s temperatures would probably have been hotter
at some time in the last couple of millenia. What that means is that it's probably more than 7,000 years since there was a similar run of hottest months on record. That is, not since the Holocene climatic optimum (and it's probably hotter now than it was back then)..."
Graphic credit: "
Global mean surface temperature for El Nino years". Data source:
GISS NASA.
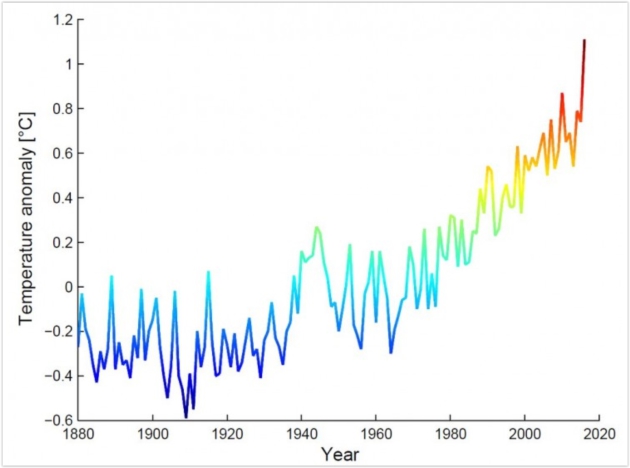
Earth Just Recorded Its Warmest April on Record, And It Wasn't Even Close. More perspective from Andrew Freedman at
Mashable: "...
The
record all but assures that 2016 will set another milestone for the
warmest calendar year in NASA's database, regardless of whether the rest
of this year sees comparatively cooler global temperatures. During each
of the past seven months, global average surface temperatures have
exceeded the 20th century average by more than 1 degree Celsius, or 1.8
degrees Fahrenheit. Until October, that 1-degree threshold had not been
crossed since NASA's global temperature records began in 1880..." (Image: NASA GISS).
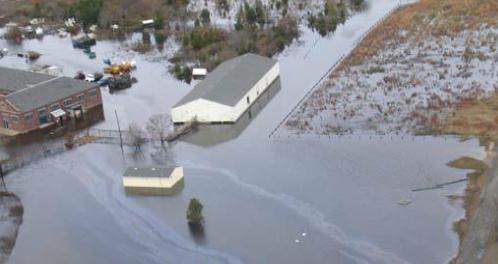 Lloyd's of London Urges U.S. Government To Stop Insuring Floods
.
Financial Times ran an article that made me do a double-take; here's an excerpt: "
Lloyd’s of London
insurers have called on the US government to stop providing cover for
flood damage, arguing that state support has become unsustainable and
encourages irresponsible housebuilding. The national flood insurance programme
has 5.2m policyholders, takes in about $3.4bn in premiums a year and
covers $1.3tn worth of assets. But it has racked up debt of $23bn,
mainly because of the costs from disasters such as Hurricane Katrina and
Superstorm Sandy..." (File photo: NOAA).
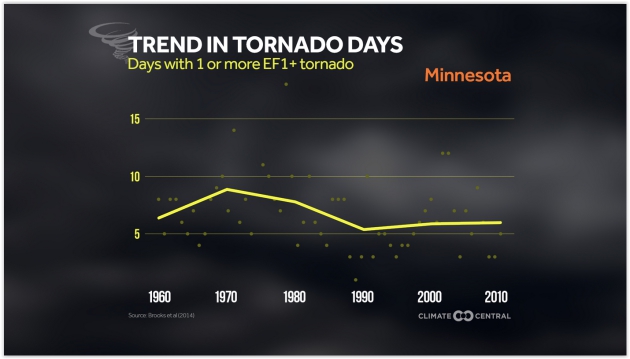
Fewer Tornado Days, But More Big Outbreaks.
WXshift takes a look at the trends - natural variation or something more? Here's an excerpt: "...A
2014 NOAA study examined
trends in the tornado record for a possible climate change signal.
Since the early 1970s, the nationwide average annual number of days with
at least one (E)F1 or stronger tornado has dropped from 150 to 100.
Yet, there has been an increase in the number of days with a very high
number of tornadoes. In the 1970s, the average number of days with more
than 30 (E)F1 or stronger tornadoes was less than one. In the last
decade, that number had jumped to 3..."
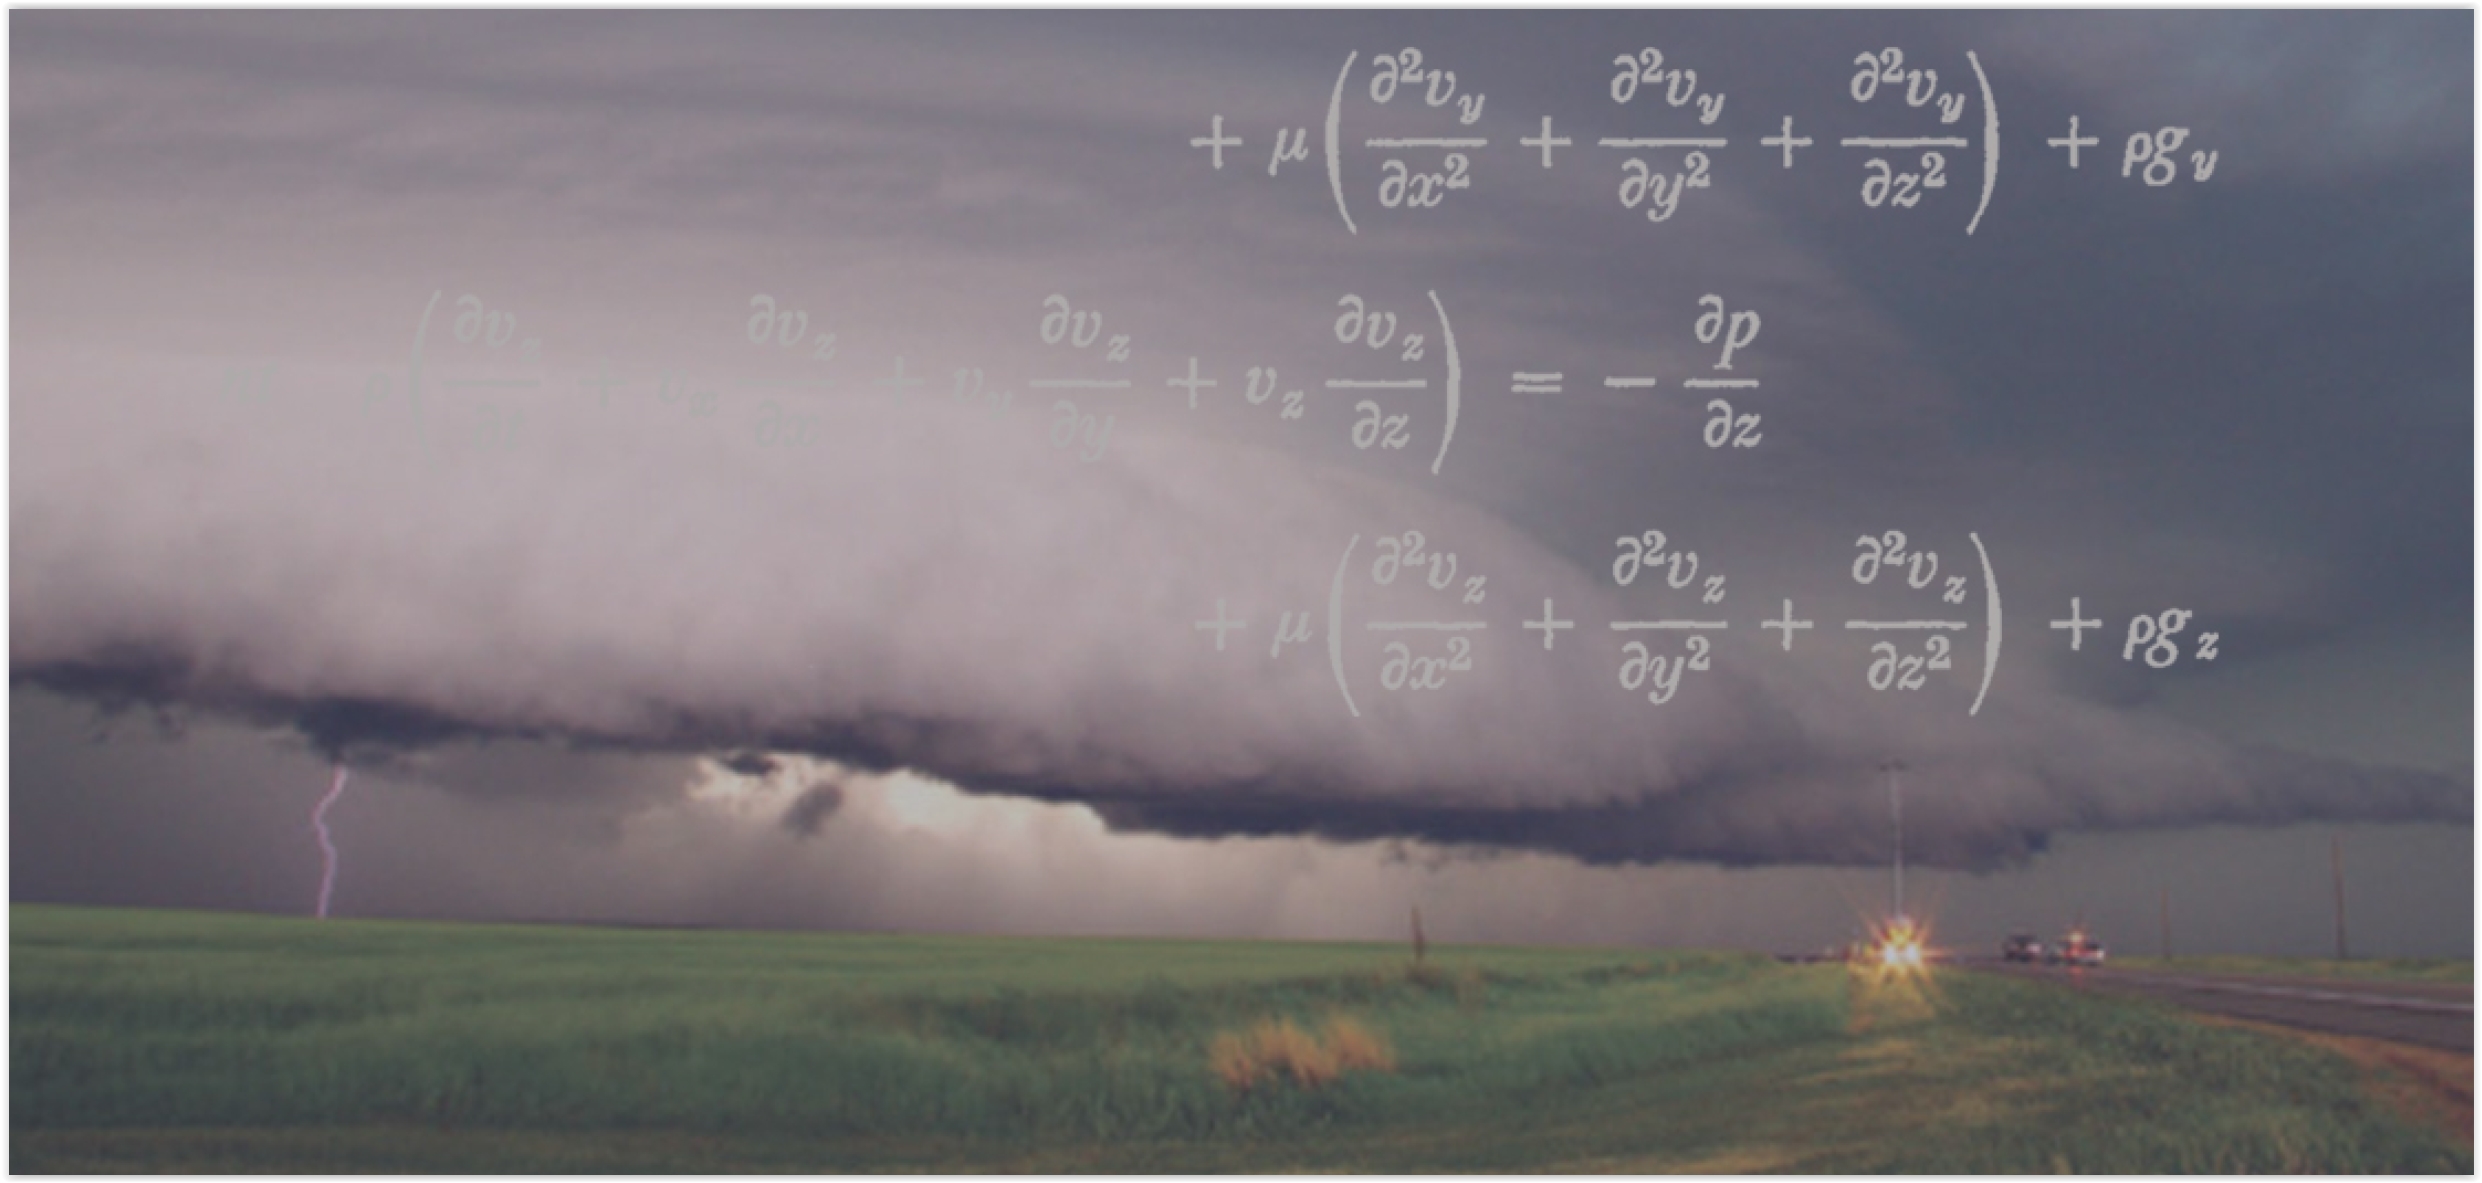
Weather Prediction: It's Math! Lot's and lot's of math - calculus that still gives me night-sweats. Here's an excerpt from
NOAA: "
Dutifully
processing 2.8 quadrillion mathematical calculations per second around
the clock, these computers — each about the size of a school bus — are
the nucleus of weather and climate forecasting in the United States and
the calculations they make are the foundation of NOAA’s life-saving
weather predictions. Every day, the supercomputers collect and organize
billions of earth observations, such as temperature, air pressure,
moisture, wind speed and water levels, which are critical to initialize
all numerical weather prediction models. All these observations are
represented by numbers..."
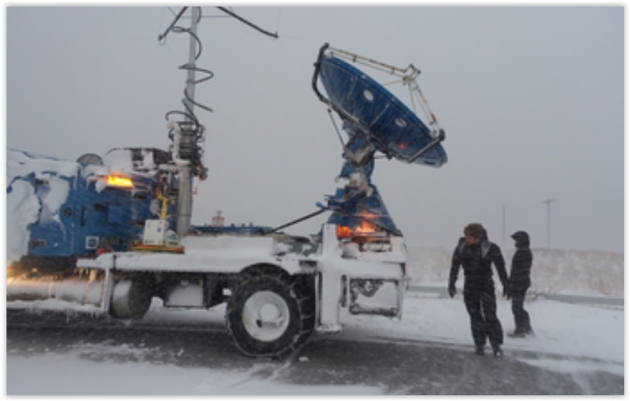
Mission Impossible? New England's Snowstorm "Bomb" From Inside a Doppler-On-Wheels. Here's an excerpt of an interesting series from NSF, the
National Science Foundation: "
Jan. 26, 2015.
The day computer models forecast one of the most intense snowstorms in
history. Meteorologists call it a "bomb." The bomb would hit coastal New
England that afternoon. And night. And the next morning. Eventually it
blitzed the region with more than 3 feet of snow. Blizzard warnings were
issued from New Jersey to Maine. Cities in the path of the storm ground
to a halt. In the first driving snows, a Doppler-on-Wheels (DOW) mobile
radar--a truck with a swiveling radar dish mounted on its back like a
huge eye--made its way through Massachusetts..."
Photo credit: "
DOW scientists Karen Kosiba and Traeger Meyer brave winds gusting more than 50 miles per hour." Credit: Josh Wurman, Karen Kosiba, Center for Severe Weather Research
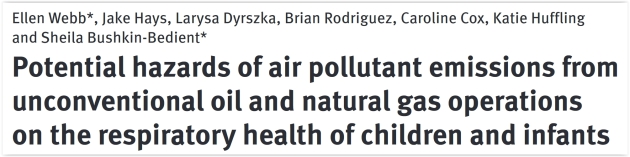
Fracking's Air Pollution Puts Infants and Children at Risk of Developing Heart, Lung Problems.
Truthout has the article; here's the intro: "
A newly published peer-reviewed study concludes
that air pollution from fracking puts people's lungs, hearts, and
immune systems at risk -- and that the health risks are particularly
pointed for young children and infants. The study -- the first to
specifically focus on how shale oil and gas drilling affects children
ability to breathe -- concludes that starting in the womb, children's
developing respiratory systems are particularly at risk from five
airborne pollutants associated with fracking and drilling..."
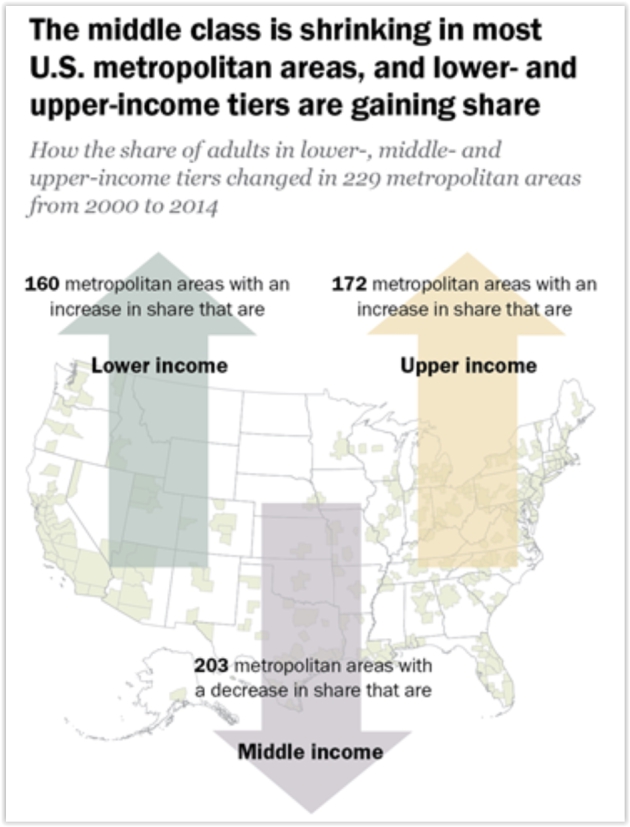
America's Shrinking Middle Class: A Close Look at Changes Within Metropolitan Areas. Why are we so angry? New findings from Pew Research Center offers strong clues: "The
American middle class is losing ground in metropolitan areas across the
country, affecting communities from Boston to Seattle and from Dallas
to Milwaukee. From 2000 to 2014 the share of adults living in
middle-income households fell in 203 of the 229 U.S. metropolitan areas
examined in a new Pew Research Center analysis of government data. The
decrease in the middle-class share was often substantial, measuring 6
percentage points or more in 53 metropolitan areas, compared with a
4-point drop nationally..."
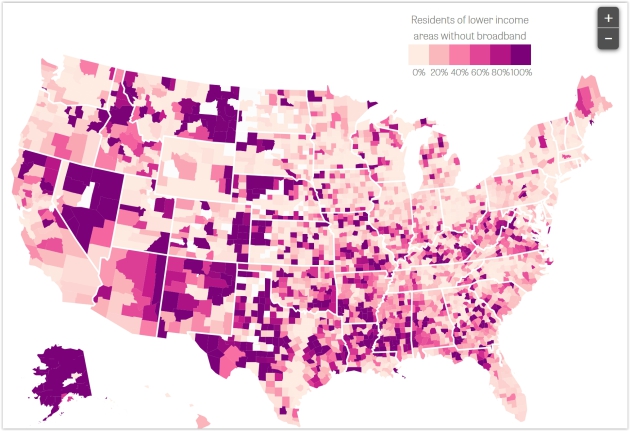
Rich People Have Access to High-Speed Internet; Many Poor People Still Don't. Here's an excerpt from a story at the
Center for Public Integrity: "...
An
investigation by the Center for Public Integrity found that even though
Internet access has improved in recent years, families in poor areas
are almost five times more likely not to have access to high-speed
broadband than the most affluent American households. That means no
access to online jobs, and no access to health care advice, education,
government services and banking — everything needed to be a full
participant in today’s society. This harsh reality has led to a new kind
of segregation. “Internet access,” says James Lane, superintendent of
Goochland County Public Schools, “is the civil rights issue of our time...”
Scientists Can Now Make Lithium-Ion Batteries Last a Lifetime. Computerworld has the story; here's the intro: "Who
says playing around is a waste of time? Researchers at the University
of California at Irvine (UCI) said that's exactly what they were doing
when they discovered how to increase the tensile strength of nanowires
that could be used to make lithium-ion batteries last virtually forever.
Researchers have pursued using nanowires in batteries for years because
the filaments, thousands of times thinner than a human hair, are highly
conductive and have a large surface area for the storage and transfer
of electrons..."
Photo credit: "
University
of California doctoral student Mya Le Thai holds a nanowire device that
has the potential to enable hundreds of thousands of recharges in a
lithium-ion battery." Credit:
Steve Zylius/UCI
Try Not To Jiggle While Watching These Amazing Bladeless Wind Turbines. Is this the future of wind power? Here's an excerpt from upworthy.com: "...It's
called Bladeless, and it's a wind turbine with — you guessed it — no
blades.The bladeless turbines are massive poles jutting out of the
ground. Because they're thinner than a regular wind turbine and have no
blades, more of them can fit into a space, meaning more electricity can
be generated while taking up less real estate. So how does the bladeless
turbine generate power?..."
Image credit: "
Jiggle jiggle jiggle." GIF via
Vortex Bladeless/YouTube.
Why Impactful Businesses Generate More Profit. Here's an excerpt of an interesting post at
virgin.com: "
What’s
worked before is no longer an option. It’s time for Maverick
entrepreneurs, visionary creators, change makers, and impactful leaders
to rewrite the rules of business for the 21st century. In fact, I predict that businesses without a core impact will be at a competitive disadvantage in four to seven years (or less). The time has come for an Evolved Enterprise
to create (or re-create) a company that authentically comes straight
from your true essence, wrapped around a meaningful impact, and then
develops the community, culture, and product or service in total
alignment. And the most interesting part is all of this is actually good for business in all ways..."
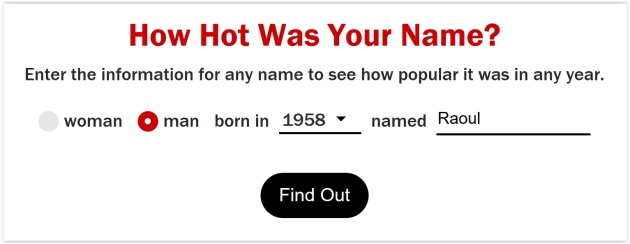
Find Out If Your Name Was Ahead of Its Time. How popular was your name when you were born? A calculator at TIME brings out the inner-narcissist in all of us: "...To find out how popular your name was
when you were born—and how it has fared since then—enter your gender,
birth year and first name into this interactive. We’ll tell you which of
eight categories your name fits into based on your birth year, like “trendsetter,” “Mr. or Ms. Popular,” or even a “snowflake”—a name that was never common..."
Anthony Bourdain On The One Type of Food You Should Never Eat. Amen brother. Here's a clip from
TIME: "...
But
there are a few things the No Reservations and Parts Unknown host will
never eat again, including Icelandic fermented shark, Namibian warthog
rectum —and airplane food. In a conversation with Bon Appetit,
Bourdain claimed that he never eats the food on the many, many plane
rides he takes as he travels the world. “Never,” said Bourdain. “No one
has ever felt better after eating plane food. I think people only eat it
because they’re bored. I don’t eat on planes. I like to arrive hungry...”
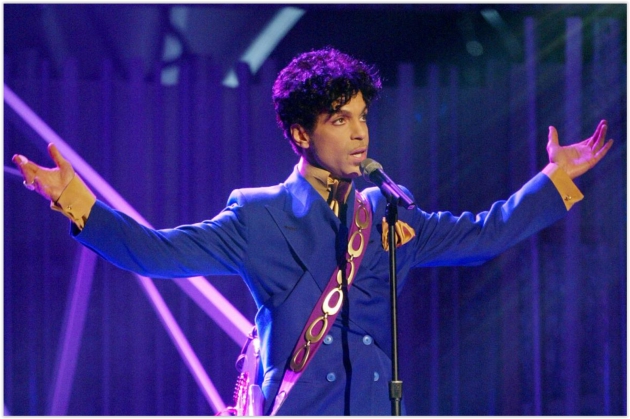
Prince's Final Revolution: How The Purple One Transformed The Way We Grieve. Here's an excerpt of a poignant post at
City Pages: "...
Regardless of whatever’s in those vaults,
Prince’s final and perhaps his most vital, beguiling stunt, the one
that will resonate the furthest, is how he transformed the way we grieve
in public. This is territory previously unknown. We are celebrating at
the funeral. In the aftermath of death, we say things like “what a life”
or “we were blessed to have known this person,” but these are
platitudes. It’s small talk for people with nothing to say. No platitude
can soften the blunt emptiness brought with this kind of permanence.
The only real shelter from grief is time..." (Image credit:
Slate).
TODAY: Some sun, then clouds increase. Passing shower likely. Winds: NW 7-12. High: 64
MONDAY NIGHT: Evening sprinkle, then clearing. Low: 44
TUESDAY: Bright sun, much nicer. Winds: NE 7-12. High: 67
WEDNESDAY: Sunny, pretty close to perfect. Wake-up: 46. High: near 70
THURSDAY: Lukewarm sun, distractingly nice. Winds: S 8-13. Wake-up: 51. High: 74
FRIDAY: Intervals of sun, cabin-worthy. Winds: S 10-15. Wake-up: 53. High: 73
SATURDAY: Potentially postcard perfect. Sunny. Winds: S 7-12. Wake-up: 56. High: 77
SUNDAY: Blue sky with a warm breeze. Wake-up: 60. High: near 80
Climate Stories...
NASA: April 2016 Was The Seventh Consecutive Warmest Month on Record for Earth. Here's a clip from a post by Dr. Jeff Masters at
Weather Underground: "
Every
month from October 2015-April 2016 has now had a departure of 1 degree
Celsius or greater above the 1951-1980 average used by NASA. The
departure from average in a single month had never exceeded 1 degree
Celsius prior to October dating back to 1880. April 2016 also continues a
string of 369 consecutive months at or warmer than average. The last
colder-than-average month in NASA's database was July 1985..."
A Song of Fire and No Ice: We Just Had Our Fourth Record-Breaking Hottest Month in a Row. Here's an excerpt from
ThinkProgress: "...
How
big a jump was April 2016 compared to the historical record? In an
email, Stefan Rahmstorf, Head of Earth System Analysis at the Potsdam
Institute for Climate Impact Research, notes that “The margin by which
April beats the previous record April is three times larger (0.24 °C)
than the margin of any previous record April (biggest was 0.08 °C).”
Also, this has easily been the hottest January-April on record, which
isn’t a surprise given that last month’s record was hot on the heels of
the hottest March on record by far, which followed the hottest February
on record by far, and hottest January on record by far..."
Graphic credit: "Global mean temperature anomaly (vs 1951-1980 mean), month of April only." CREDIT: NASA.
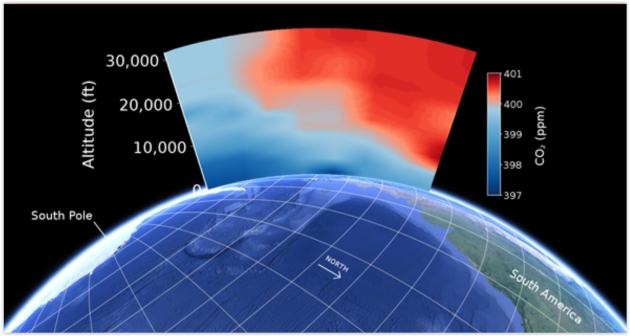
A CO2 Milestone in Earth's History. 400 ppm over Antarctica too? Here's an excerpt from
UCAR: "
Earth’s
atmosphere is crossing a major threshold, as high levels of carbon
dioxide (CO2)—the leading driver of recent climate change—are beginning
to extend even to the globe's most remote region. Scientists flying near
Antarctica this winter captured the moment with airborne CO2 sensors
during a field project to better understand the Southern Ocean's role in
global climate. This illustration shows the atmosphere near Antarctica
in January, just as air masses over the Southern Ocean began to exceed
400 parts per million of CO2. The 400 ppm level is regarded as a
milestone by climate scientists, as the last time concentrations of the
heat-trapping gas reached such a point was millions of years ago, when
temperatures and sea levels were far higher..."
Illustration credit: Eric Morgan, Scripps Institution of Oceanography.
A Brief History of Climate Science. If anyone asks the science dates back to Fourier in the 1820s. Here's an excerpt from climate scientist Ed Hawkins at
The Conversation: "...
What was missing however was an estimate of how much these gases could warm or cool the planet. Svante Arrhenius,
a Swedish chemist, provided the first numerical estimates of “climate
sensitivity” – defined as the temperature change corresponding to a
doubling of carbon dioxide in the atmosphere. He suggested a value
around 4°C in 1896. While the scientists continued to debate the causes
of the ice ages, the Earth was warming. From the 1920s onwards
meteorologists began to realise that the climate of various regions had
changed. Joseph Kincer
suggested in 1933 that temperatures in individual cities had been
rising. At the same time, others had started measuring carbon dioxide in
the atmosphere. But it took an amateur meteorologist to put the puzzle
together..."
Image credit: "
The future of the globe used to look a lot brighter."
ToastyKen.
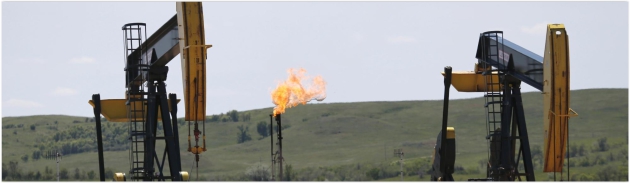
Obama Administration Issues New Rules on Methane Emissions from the Oil and Gas Industry. The rules only apply to new point sources, as explained at
VICE News: "
The
Obama administration issued new rules on Thursday for reducing
climate-warming methane emissions from the oil and natural gas sector,
continuing its string of executive branch actions aimed at addressing
climate change. The regulations cover only new or substantially modified
oil and gas facilities: wells, processors, storage facilities, and
pipelines. The administration says it will be up to the next president
to lead the charge on reining in emissions from existing sources. US
Environmental Protection Agency Administrator Gina McCarthy said the
rules highlight President Barack Obama's commitment to addressing
climate change, and limiting pollutants that compromise public health..."
Photo credit: Charles Rex Arbogast/AP.


No comments:
Post a Comment