83 F. high in St. Cloud Tuesday.
80 F. average high on August 16.
80 F. high temperature on August 16, 2015.
.14" rain fell at KMSP as of 7pm yesterday. A trace fell at St. Cloud
August 17, 1946:
A tornado kills 11 people in the Mankato area around 6:52PM. A 27-ton
road grader is hurled about 100 feet. Another tornado an hour later
destroys downtown Wells.
Shorts Today - Risk of Light Weekend Jackets
This
time Louisiana won the Unlucky Lotto of Weather Misfortune: over 31
inches of rain near Baton Rouge; a thousand-year rain event. I saw a
"precipitable water" value of 2.8 inches, literally off the charts.
Coming after the warmest July on record.
What
makes this even more remarkable is the fact that historic rainfall
dropped out of a storm with no name. It wasn't a hurricane or tropical
storm, just a stalled tropical disturbance, drawing moisture from an
unusually warm and wet environment. Not having a named tropical storm to
track (and hype) made it more of an unwelcome surprise. Increasingly,
expect the unexpected.
A dry sky cooperates with outdoor plans today and Thursday, but a southbound cool front, a whiff of fresh Saskatchewan air, will shove T-storms into town late Friday.
This weekend brings the first note-worthy brush of fall air. Showers taper Saturday, but clouds and a stiff north breeze may keep daytime temperatures stuck in the 60s. Sunday looks sunnier and milder; 80s return next week.
Good news: no floods, fires or obnoxious heat waves, thank God.
*
Doppler radar rainfall estimates from Tuesday's evening's swarm of
strong to severe storms - numerous reports of 1-2" rains falling in a
short period of time; even more over the south metro.
Convection
from Space. Here is what the 1km visible satellite loop looked like
during the late afternoon yesterday as storms flared up along weak
outflow boundaries leftover from morning storms. Look carefully and you
can see overshooting tops, little knobs on top of T-storm anvils; areas
of maximum upward velocity (and largest hail). Source: WeatherTap.
Tracking Severe Storms on my Smartphone.
Here is what I was staring at on my iPhone during the late afternoon
and evening hours as strong to severe T-storms mushroomed directly over
the Twin Cities. There were reports of .75 to 1.5" diameter hail,
frequent lightning and flash flooding with these cells. Source: Aeris
Pulse and Aeris Enterprise Mobile.
More Heavy Storms Friday?
Our internal model ensemble tripped a trigger, hinting at 1"+ rainfall
amounts Friday as a cooler front approaches. Source: Aeris Enterprise.
Sweatshirt Weather This Weekend?
Models suggest lows dipping into the mid 40s to low 50s across central
and northern Minnesota by Sunday morning, a brief taste of what's to
come. Source: Aeris Enterprise.
Canadian Exhaust.
A few more days in the 80s, then a north breeze kicks in this weekend,
making it a little tougher to take that dip in the lake (although your
favorite lake may be warmer than the outside air temperature). Never
fear: 80s return next week. ECMWF data: WeatherBell.
Louisiana Flood of 2016 Resulted from 2-Day, "1,000-Year" Rainfall.
NOLA.com in New Orleans has details: "
The Louisiana Flood of 2016 was triggered by a complicated, slow-moving low-pressure weather system that dumped as much as two feet of rain on parts of East Baton Rouge, Livingston and St. Helena
parishes in 48 hours. The record two-day rainfall in those areas had a
0.1 percent chance of occurring in any year, the equivalent of a
"1,000-year rain", according to the Lower Mississippi River Forecast Center, based at the Slidell office of the National Weather Service..."
Map credit: "This
color-coded map shows the chance that the 48-hour rainfall totals
through 7 a.m. Saturday have of occurring in any year. The areas marked
white have a 0.1 percent chance of occurring any year, the equivalent of
a so-called 1,000-year rainfall event."
40,000+ Homes Impacted by Flooding.
The Weather Channel has details.
Worst Natural Disaster Since Superstorm Sandy in 2012? So says the
American Red Cross: "
The
American Red Cross is helping thousands of people in Louisiana affected
by devastating flooding, likely the worst natural disaster since
Superstorm Sandy in 2012. “Relief efforts in Louisiana are challenging
with life-threatening floods and road closures making conditions
dangerous,” said Brad Kieserman, vice president, Disaster Services
Operations and Logistics for the Red Cross. “We are mobilizing a massive
relief effort with volunteers providing shelter, food and comfort right
now. The Red Cross is also sending in additional relief supplies and
volunteers to expand our response in the coming days...”
No Words.
It's easy to get hung up on statistics and meteorological explanations
and forget the human tragedy. Hundreds of thousands of Louisiana
residents are being impacted, directly or indirectly. Reuters has a
poignant
photo essay that helps to humanize this overwhelming tragedy.
Deluge in Louisiana. Here's an excerpt from
NASA's Earth Observatory: "
Days
of intense rainfall in August 2016 led to widespread flooding in
southern Louisiana, as rivers swelled high above their banks and many
crested at record-high levels. According to news reports, the floods
prompted the rescue of at least 20,000 people and caused at least nine deaths.
Louisiana’s governor declared a state of emergency on August 12 and a
“major disaster” on August 14. The animation above shows satellite-based
measurements of the rainfall as it accumulated over the southern United
States. Specifically, it shows rainfall totals every three hours over
the span of 72 hours from August 12-14, 2016. These rainfall totals are
regional, remotely-sensed estimates, and local amounts can be
significantly higher when measured from the ground..."
How Over 2 Feet of Rain Caused Historic Flooding in Louisiana in Less Than 72 Hours. Basic physics: a warmer atmosphere holds more water vapor. Angela Fritz has perspective at
Capital Weather Gang: "...
The
disaster was caused by two weather-related features — extreme humidity
and near-stationary low pressure that hovered over the Gulf Coast for
days. Precipitable water — a measure of how much moisture is in the air
over a certain location — was off the charts. Day after day, weather
balloons relayed precipitable-water data that came close to or exceeded
any other weather event on record in the region. On Friday morning, the
precipitable-water reading was 2.8 inches. “Obviously we are in record
territory,” the National Weather Service wrote.
Moisture values this large increase the likelihood of major flooding
when there’s a sufficient trigger mechanism, like a low pressure cyclone..."
Graphic credit: "The amount of moisture in the air over southern Louisiana this weekend was off the charts." (National Weather Service)
How The Deadly Louisiana Floods Happened, And Why You Should Worry. Andrew Freedman reports at
Mashable: "
The
Louisiana floods, which have now killed at least six and led to the
evacuation of 20,000, were the result of a bizarre confluence of weather
events that are becoming suspiciously more common as the planet's
climate continues to warm. First off, the atmosphere was primed for
heavy rain for days on end along the central Gulf Coast, with
precipitable water values (the amount of water vapor in a column of air
above a specific location) hitting record levels in Louisiana - beating
out readings seen during tropical storms and hurricanes going back to
1948..."
Photo credit: "
A vehicle is submerged in floodwaters in Youngsville, La., Sunday, Aug. 14, 2016." Image: Scott Clause - The Lafayette Advertiser/AP.
Why The Deadly Louisiana Flood Occurred.
The fact that there was no named tropical system probably added to the
overall lack of preparation for this level of historic flooding. No-name
tropical disturbances that stall for extended periods of time can be
even more damaging (from an inland flooding perspective) as Category 5
hurricanes. Here's an excerpt at
Scientific American: "...
The
Louisiana storm was a freak event driven by the atmosphere and the
ocean. At present, scientists do not know enough to attribute dynamic
storms of this sort to climate change. But broaden the focus a little,
and some links appear. The frequency and intensity of heavy rainfall
events have increased globally, said Kenneth Kunkel, a climate scientist
at NOAA’s National Centers for Environmental Information. “Each decade,
it has been higher than the previous decade, for about the last 30 to
40 years,” he said. Both the land and the oceans have been warming up,
which has increased the amount of water vapor in the atmosphere, he said..."
 2016 Is Already a Year of Historic U.S. Weather Extremes
. West Virginia, Houston, now Louisiana. Here's the intro to a review from
Huffington Post: "
Just
a little over halfway into 2016 and this year is shaping up to be
another defined by extreme weather events exacerbated by climate change.
As of Tuesday afternoon, at least eight people have died in catastrophic flooding in south Louisiana after heavy rains that started Friday submerged entire communities: More than 20,000 people needed
to be rescued. “Nothing has ever happened like this before. We didn’t
think it was going to do this,” Baton Rouge resident Emily Henderson,
63, told The Huffington Post..."
Photo credit: "Max Becherer/ASSOCIATED PRESS. "
An aerial photo over Amite, Louisiana, shows homes flooded by heavy rains, Aug. 13, 2016."
 NOAA Launches America's First National Water Forecast Model
.
NOAA has details: "
Launched
today and run on NOAA’s powerful new Cray XC40 supercomputer, the
National Water Model uses data from more than 8,000 U.S. Geological
Survey gauges to simulate conditions for 2.7 million locations in the
contiguous United States. The model generates hourly forecasts for the
entire river network. Previously, NOAA was only able to forecast
streamflow for 4,000 locations every few hours. The model also improves
NOAA’s ability to meet the needs of its stakeholders — such as emergency
managers, reservoir operators, first responders, recreationists,
farmers, barge operators, and ecosystem and floodplain managers — with
more accurate, detailed, frequent and expanded water information..."
Scorching July is World's Hottest Month on Record. The trend continues. Here's an excerpt from
Climate Central: "
The
reign of record hot months in 2016 continues, with last month claiming
the title of hottest July on record globally, according to data released by NASA
on Monday. This July was also the hottest month on record for the
world. The streak means that 2016 is still well on its way to upsetting
last year as the hottest year on record. Or as Gavin Schmidt, director
of NASA’s Goddard Institute of Space Studies, said on Twitter, there is still a 99 percent chance 2016 will take the top slot..."
Image credit: "
How temperatures across the globe differed from average in July 2016." Credit: NASA.
Blue Cut Fire in SoCal Results in Mandatory Evacuation for 82,000 Residents. From too much water to not nearly enough water,
ABC7.com in Los Angeles has details: "
The fast-moving Blue Cut Fire, which has scorched more than 9,000 acres in the San Bernardino National Forest,
has forced at least 82,000 people to evacuate. The San Bernardino
County Sheriff's Department said it is important that people evacuate
when ordered, as the blaze is out of control with 0 percent containment..."
Center of U.S. Tornado Activity Shifting South and East, Possibly Due to Climate Change. Here's a summary of recent research, courtesy of
Purdue University: "
A
Purdue University research team has found that the center of tornado
activity in the United States has shifted in recent decades, and this
shift is possibly influenced by climate change. “This completely
redefines annual tornado activity in the United States,” said Ernest
Agee, a professor in the Department of Earth, Atmospheric, and Planetary
Sciences. Findings detailed in a paper that appeared Aug. 4 in the
Journal of Applied Meteorology and Climatology, published by the
American Meteorological Society, show evidence that the central area of
annual tornado activity has moved from Oklahoma to Alabama..."
The List of Cities That Could Host the 2088 Olympics is Very, Very Short. Co.Design takes a look at the implications for the Olympic games your grandchildren may be watching someday: "...Even a normal summer day can feel suffocating for athletes whose bodies are working at the threshold of their physical limits,
like those competing this month in Rio. But as our planet grows warmer
over our lifetimes, the number of cities that will be cool enough to
reasonably host the summer games is going to rapidly dwindle. And that
doesn’t just mean Atlanta or L.A. According to an analysis published in The Lancet last week, The Last Summer Olympics? Climate change, health, and work outdoors,
only three plausible host cities in the entire continent of North
America may still be low risk by 2085 (or the summer games of 2088): San
Francisco, Calgary, and Vancouver. There may be zero in Africa or Latin
America, and only two in Asia (Bishkek, in Kyrgyzstan, and Ulaanbaatar,
in Mongolia)..."
* The paper is at
The Lancet.
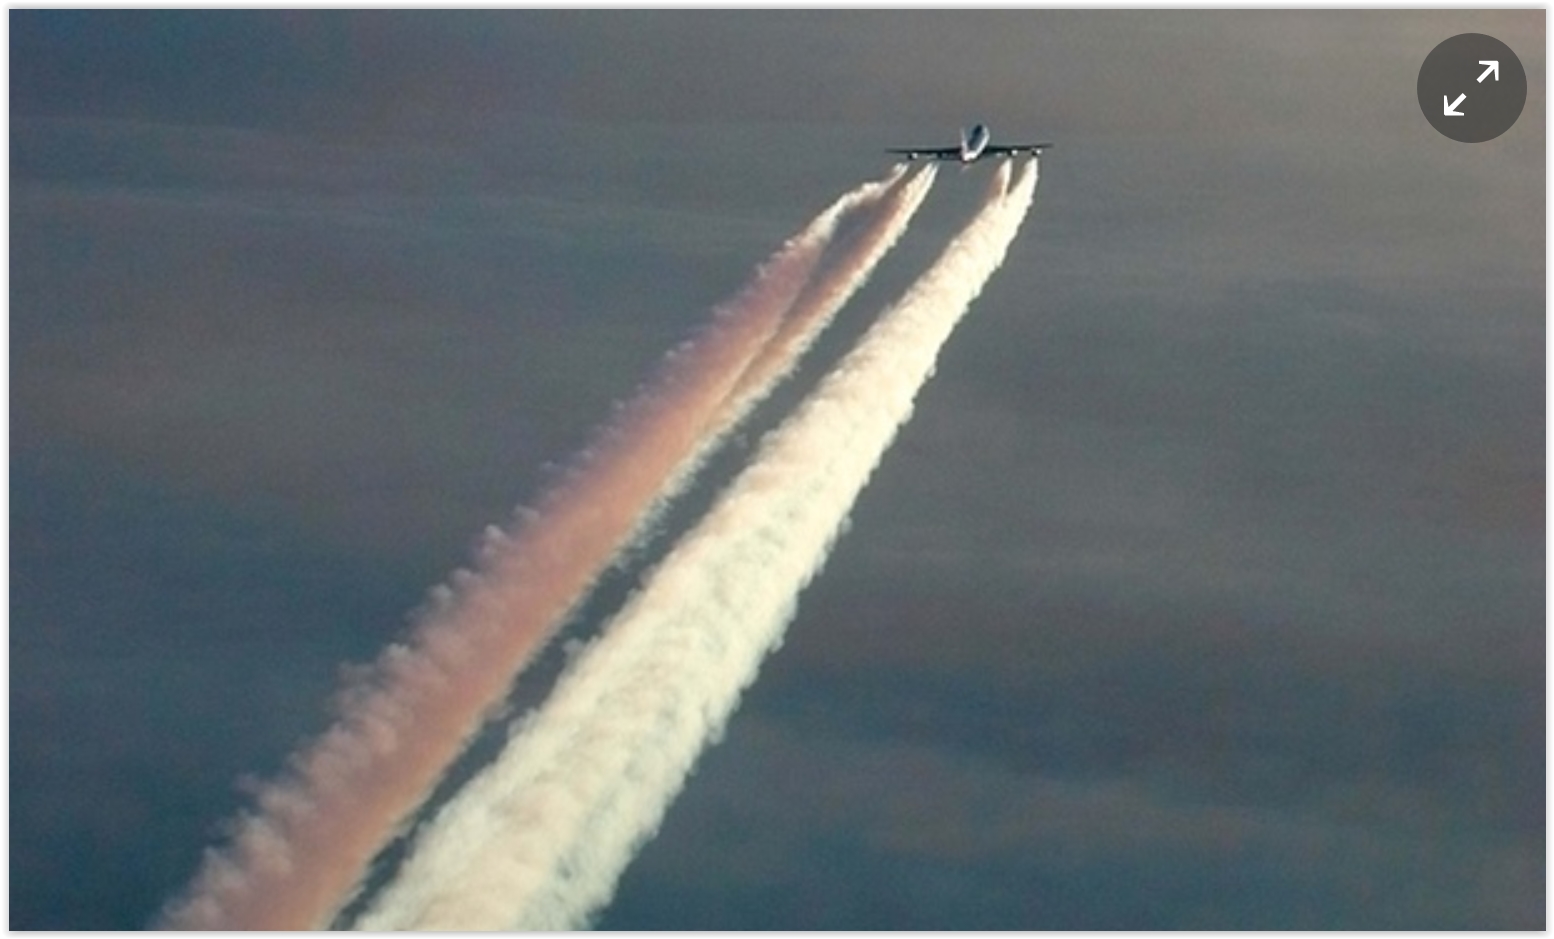
Scientists Just Say No to "Chemtrails" Conspiracy Theory.
Is the government really experimenting on us? Call me crazy, but I
doubt it - so do most scientists who have studied this. Here's the
intro to a
New York Times story: "
Conspiracy
theories can be stubborn, particularly in the echo chamber of the
internet. One persistent belief in some quarters is that the government —
or business, perhaps — is deploying a fleet of jet aircraft to spray
chemicals into the sky to control the population, food supply or other
things. As evidence, they point to what they call “chemtrails,” which
are more commonly known as contrails, or condensation trails, produced
at high altitudes as water vapor in jet engine exhaust condenses and
freezes..." (Image: Alamy).
Putting a Computer in Your Brain Is No Longer Science Fiction. Here's a clip at
The Washington Post: "...
What’s
uncommon is how Johnson wants to respond: find a way to supercharge the
human brain so that we can keep up with the machines. From an
unassuming office in Venice Beach, his science-fiction-meets-science
start-up, Kernel, is building a tiny chip that can be implanted in the
brain to help people suffering from neurological damage caused by
strokes, Alzheimer’s or concussions. The team of top neuroscientists
building the chip — they call it a neuroprosthetic — hope that in the
longer term, it will be able to boost intelligence, memory and other
cognitive tasks..."
Audi to Sell Cars That Talk to Traffic Lights. Here's a headline that would have been unimaginable a generation ago, but with sensors and IoT?
The Guardian reports: "
The
German carmaker Audi is rolling out technology that will allow its
vehicles to communicate with traffic lights. Audi of America, which is
owned by Volkswagen, said select 2017 Q7 and A4 models built after 1
June 2016 would be equipped with the system. Audi’s version of
technology known in the industry as “V-to-I”, or vehicle to
infrastructure, displays a countdown before a red light turns to green,
with a countdown also appearing when it is too late to get through an
approaching signal before it turns red..."
Photo credit: "
Audi’s Q7 model will test ‘vehicle to infrastructure’ technology in the US." Photograph: Audi.
Shorter-Range Electric Cars Meet the Needs of Almost All U.S. Drivers. Here's a clip at
Ars Technica: "
The
vast majority of American drivers could switch to battery electric
vehicles (BEVs) tomorrow and carry on with their lives unaffected,
according to a new study in Nature Energy. What's more, those BEVs need
not be a $100,000 Tesla, either. That's the conclusion from a team at
MIT and the Santa Fe Institute in New Mexico that looked at the
potential for BEV adoption in the US in light of current driving
patterns. Perhaps most interestingly, the study found that claim to be
true for a wide range of cities with very distinct geography and even
per-capita gasoline consumption..." (Photo credit: Nissan).
* The paper referenced in the Ars Technica article above is
here.
A Visual Guide to How Terribly the World's Best Human Athletes Fare Versus Most Average Animals. We're not as impressive as we think we are. Here's an excerpt from
Atlas Obscura: "...
But the world's most extraordinary human runner would not beat, say, an ordinary warthog. A warthog can run around 30 miles per hour on an average day—no training, no audience, no special wind conditions. Housecats also regularly reach this speed, as do grizzly bears, rabbits, and white-tailed deer. The roadrunner can run 25 mph even though it can also fly. A certain class of butterflies, called skippers,
can get up to 37. The Olympics may have us all misty-eyed at the
heights (and lengths, and speeds, and depths) of human achievement. But
if we were ever to open the stadium gates to the whole animal kingdom,
we'd quickly be put back in our place..."
Graphics credit:
Michelle Enemark.
Today's Men Are Not Nearly As Strong As Their Dads Were, Researchers Say. Here's an excerpt of an eye-opening story at The Washington Post: "...A new study in press at the Journal of Hand Therapy
(yes, a real thing) finds that millennial men may have significantly
weaker hands and arms than men the same age did 30 years ago.
Researchers measured the grip strength (how strongly you can squeeze something) and pinch strength
(how strongly you can pinch something between two fingers) of 237
healthy full-time students aged 20 to 34 at universities in North
Carolina. And especially among males, the reduction in strength compared
to 30 years ago was striking..."
Photo credit: "
This is your dad. He can still crush you like a twig." AFP PHOTO / MARK RALSTON.
 TODAY
TODAY: Warm sunshine - no red blobs on Doppler. Winds: SW 3-8. High: 85
WEDNESDAY NIGHT: Clear and mild. Low: 66
THURSDAY: Partly sunny and sticky with a risk of T-storms. Winds: S 8-13. High: 88
FRIDAY: Muggy with lingering T-storms likely. Winds: NW 5-10. Wake-up: 70. High: 82
SATURDAY: Early hints of Autumn. More clouds than sun, brisk. Winds: N 10-20. Wake-up: 61. High: 68
SUNDAY: Better day. Partly sunny, comfortable. Winds: NW 8-13. Wake-up: 56. High: 72
MONDAY: Lot's of lukewarm sunshine. Winds: S 8-13. Wake-up: 57. High: 79
TUESDAY: Some sticky sun, stray T-shower. Winds: S 10-20. Wake-up: 59. High: 81
Climate Stories...
Flooding in the South Looks a Lot Like Climate Change. The New York Times reports: "
Climate
change is never going to announce itself by name. But this is what we
should expect it to look like. That’s what many scientists, analysts and
activists are saying after heavy rains in southern Louisiana have killed at least eight people
and forced tens of thousands of residents from their homes, in the
latest in a series of extreme floods that have occurred in the United
States over the last two years. That increase in heavy rainfall and the
resultant flooding “is consistent with what we expect to see in the
future if you look at climate models,” said David Easterling, a director
at the National Centers for Environmental Information, which is
operated by the National Oceanic and Atmospheric Administration. “Not
just in the U.S. but in many other parts of the world as well...”
Photo credit: "Volunteers pitched in to help residents fill sand bags against flooding from the Vermilion River in Lafayette, La., on Monday." Credit Scott Clause/The Daily Advertiser, via Associated Press.
What We Can Say About the Louisiana Floods and Climate Change. Chris Mooney connects the dots at
The Washington Post; here's an excerpt: "...
Observations
over the US and many other places around the world show that heavy rain
events have been becoming heavier over the last several decades.
Climate models very consistently predict that this should happen as the
climate warms, and basic physics leads us to interpret this change as,
in large part, a consequence of increasing water vapor in
the atmosphere,” explains Adam Sobel, a climate scientist at Columbia
University. “On this basis we can say that climate change has most
likely increased the probability of an event like this. One still can’t
say that climate change ’caused’ this event, as each event has many
causes and no event can be viewed solely as a consequence of long-term
trends...”
Map credit above: "
The
map shows percent increases in the amount of precipitation falling in
very heavy events (defined as the heaviest 1% of all daily events) from
1958 to 2012 for each region of the continental United States. (Figure
source: updated from Karl et al. 2009)." Image source: 2014 National Climate Assessment.
World's Hottest Month Shows Challenges Global Warming Will Bring. The Guardian reports: "In Siberia, melting permafrost released anthrax
that had been frozen in a reindeer carcass for decades, starting a
deadly outbreak. In Baghdad, soaring temperatures forced the government
to shut down for days at a time. In Kuwait, thermometers hit a record 54C (129F). July was the hottest month the world has endured since records began in 1880, scientists have said,
and brought a painful taste of the troubles people around the world may
have to grapple with as global warming intensifies. Results compiled by
Nasa showed the month was 0.84C hotter than the 1951-1980 average for
July, and 0.11C hotter than the previous record set in July 2015..."
TV Meteorologists Seen Warming to Climate Science. Here's an excerpt from Yale Climate Connections: "Through
their own words in a series of in-person and Skype interviews, plus
clips from some recent broadcasts on extreme weather events, independent
videographer Peter Sinclair’s video describes the rapidly evolving
perspectives: prominent national and local broadcast meteorologists
saying they now see it as their responsibility to keep certain weather
events in the context of the changing climate. The TV weathercasters
featured in the video relate how their views on the science of climate
change have evolved in recent years. “I think you’re seeing more and
more TV meteorologists understand that responsibility,” says Washington
Post meteorologist Jason Samenow..."
These Photos Show How Hard Climate Change Has Hit Greenland. TIME reports: "Year
after year of record heat largely due to man-made global warming has
hit hard across the globe. And nowhere have the impacts been more
devastating than in the Arctic where temperatures are rising more than
twice as fast as the global average and ice is quickly disappearing.
Photos taken by a research team from Denmark capture how warming has hit
glaciers in Greenland, where ice melt has been occurring at a faster rate than ever in recorded history. Researchers captured the images, published in the book
The Greenland Ice Sheet, in the exact location their predecessor had
taken photos eight decades prior as temperatures had just begun to warm.
Side by side, the images offer a stark comparison showing vast areas
once covered in ice now empty land..."
Photo credit above: Natural History Museum of Denmark/University of Copenhagen Aug. 16, 1933 & July 28, 2013. "The
Karale Glacier, located just north of Tasiilaq, the largest town on the
east coast of Greenland, is almost three kilometers wide and has
retreated more than 6 kilometers over the last 80 years."
A World at War. Bill McKibbon argues that we're already at war with a rapidly changing climate. Here's an excerpt at
New Republic: "...
Day
after day, week after week, saboteurs behind our lines are unleashing a
series of brilliant and overwhelming attacks. In the past few months
alone, our foes have used a firestorm to force the total evacuation
of a city of 90,000 in Canada, drought to ravage crops to the point
where southern Africans are literally eating their seed corn, and floods
to threaten the priceless repository of art in the Louvre. The enemy is even deploying biological weapons to spread psychological terror: The Zika virus,
loaded like a bomb into a growing army of mosquitoes, has shrunk the
heads of newborn babies across an entire continent; panicked health
ministers in seven countries are now urging women not to get pregnant. And as in all conflicts, millions of refugees are fleeing the horrors of war, their numbers swelling daily as they’re forced to abandon their homes to escape famine and desolation and disease. World War III is well and truly underway. And we are losing..."
Illustration credit: Andrew Colin Beck.
Michigan Scientists See Urgency for Negative Emissions. To stay below 2C of warming it may be necessary to pull CO2 out of the atmosphere, according to a story at
Climate Central: "...
His
research, which is ongoing and has not yet been published, is
suggesting an increasingly dire situation: Countries may have only until
2026 to begin retiring most old coal-fired power plants and replacing
them with 100 percent renewable power sources, or the globe is likely to
blow through its carbon budget and exceed 2°C of warming. What happens
if countries miss that target? “Then we have no option than to remove
the CO2 we have already emitted,” Supekar said. However, nobody is
certain if removing carbon dioxide from the atmosphere — something
called “negative emissions” — to help stabilize the climate is possible
or feasible on a mass scale..."
Photo credit: "
Pollution from a power plant smoke stack." Credit: Ray Slakinski/flickr.


I always look forward for such nice post & finally I got you. Thanks for sharing this content.
ReplyDeleteCMS and ED
CMS ED Course
Very informative article. Keep writing such nice post
Taxi Services In Greater Noida
Really very impressive post & glad to read this. Good luck & keep writing such awesome content.
ReplyDeleteWeb Development Company
Software development company
wow nice i really need this
ReplyDeletegood post
ReplyDeletekeyword
good post
ReplyDeletekeyword
Checkout Happy Valentine's Day Wishes for Boyfriend
ReplyDeleteSt Pete Roofing Co
ReplyDeleteSt Petersburg Roofing Co
Tampa Bay Roofing Co
Clearwater Roofing Company
Clearwater Roofing Co
Indian Rocks Roofing Company