30 F. average high on November 30.
33 F. high on November 30, 2015.
.01" rain fell at St. Cloud yesterday.
December 1, 1998: The warmest December day ever in the Twin Cities is recorded, with a high of 68 degrees. St. Cloud rose to 61.
December 1, 1985: Parts of central Minnesota receive up to a foot of snow. Snowfall totals include 12 inches at Waseca and Milaca, 11.3 at Alexandria, and 11 inches at Fairmont and Long Prairie.
Welcome to Day 1 of "Meteorological Winter"
According to the Michigan Science Center at least one septillion (that’s 1 followed by 24 zeros) snow crystals fall from the sky every winter. And an average of 105 snow-producing storms strike the U.S. in a typical winter.
Yeah, I'm great fun at parties.
Let me welcome you to the start of "Meteorological Winter". December 1 marks the beginning of what is, historically, the coldest 90 days of the year in the Northern Hemisphere. An average of 11.9 inches of snow falls in December at KMSP, second only to January.
A little snow might brighten things up, now that the sun seems to set just after lunchtime.
I don't see any big weather controversies into early next week. Flurries taper today; if you're lucky you may spy fleeting peeks of sun Saturday.
40s Monday give way to teens and 20s late next week; the coldest airmass since February. Models are still hinting a major snow event 1 week from today, but it's way too early for specifics. Prediction: by the second weekend of December it will look like winter out there.
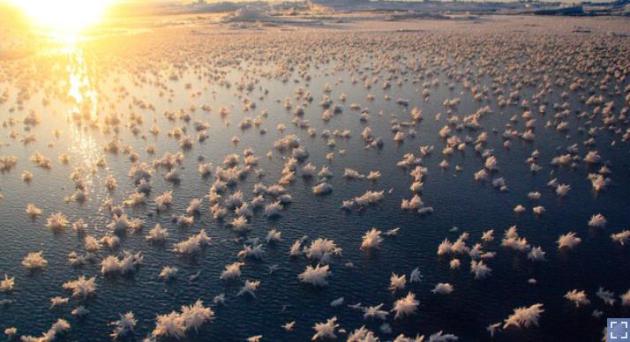
But lake ice is thin to nonexistent. Unless you want to get nearer-my-God-to-thee stay off the ice!
Photo credit: "Damage at Ider Daycare in Flatrock, Alabama." Jake Berent / WAFF.
Busiest Atlantic Hurricane Season Since 2012. Details via NOAA: "As
the Atlantic, eastern Pacific and central Pacific 2016 hurricane
seasons end today, NOAA scientists said that all three regions saw
above-normal seasons. For the Atlantic, this was the first above-normal
season since 2012. The Atlantic saw 15 named storms during 2016,
including 7 hurricanes (Alex, Earl, Gaston, Hermine, Matthew, Nicole,
and Otto), 3 of which were major hurricanes (Gaston, Matthew and
Nicole). NOAA’s updated hurricane season outlook in August called for 12
to 17 named storms, including 5 to 8 hurricanes, with 2 to 4 of those
predicted to become major hurricanes. Five named storms made landfall in
the United States during 2016, the most since 2008 when six storms
struck. Tropical Storm Bonnie and Hurricane Matthew struck South
Carolina. Tropical Storms Colin and Julia, as well as Hurricane Hermine,
made landfall in Florida. Hermine was the first hurricane to make
landfall in Florida since Wilma in 2005..."
GOES-R Is Now GOES-16! Good news from NOAA NESDIS: "November
29, 2016, NOAA's GOES-R satellite executed its final liquid apogee
engine burn without anomaly. This has placed the satellite approximately
22,000 miles away with an inclination of 0.0 degrees, meaning it has
reached geostationary orbit. GOES-R is now GOES-16! Later today, GOES-16
will perform its second stage solar array deployment, releasing the
solar array yoke and solar pointing platform. In the days that follow,
the software will be transitioned from the 'orbit raising' mission phase
to 'operational,' several maneuvers will be conducted to adjust the
satellites precise orbit, and the magnetometer boom will be deployed.
Testing and calibration of GOES-16 will then begin."
Who Gets The Most Blizzards in the USA? Western Minnesota and the Dakotas: take a bow. Here are a couple of excerpts from an interesting story at The Buffalo News: "...This maximum distribution is approximately the same now, except the number of verified blizzards has increased in the United States. Some of that may be due to climate factors or improved reporting or, in my opinion, the removal of the temperature requirement; we just don’t know...The high frequency over the northern and high plains is more closely tied to the average path taken by deep winter cyclones/low-pressure systems, placing that swath of the country most often in the colder quadrant of those storms, with howling winds and heaviest snow..."
Map credit: "Climatology of Blizzards in the Conterminous United States, 1959–2000."
Forget Inches, There Are 3 Categories of Snowstorms. My favorite college professor told us to "forget about inches", since we can't predict snow down to the inch, and instead classify storms into 3 categories: nuisance (enough to coat roads and sidewalks but travel isn't impacted too badly), "plowable" (just as the and word implies, enough snow to shovel, scrape and plow) and crippling (where everything stops - traffic is paralyzed and business pretty much shuts down). I've been borrowing the scale since 1983 at KARE-11. It has stood the test of time. Thank you Dr. Cahir at Penn State.
Photo credit: "Fire erupts on the side of The Spur on Highway 441 between Gatlinburg and Pigeon Forge, Tenn., Monday, Nov. 28 In Gatlinburg." (Jessica Tezak/Knoxville News Sentinel via AP)
"Thunderstorm Asthma" Kills 8 in Australia.
The death toll is up to 8 from the freakish combination of pollen and
thunderstorm moisture and wind; here's an excerpt of an update at The New York Times: "...Mr. McGann was one of thousands of people in Melbourne having an attack of thunderstorm asthma.
They flooded the city’s emergency rooms, swamped ambulance call lines
and joined lines around pharmacies during six hours on Nov. 21. All were
struggling for breath. About 8,500 people went to hospitals. Eight have
died, and one remains in intensive care more than a week after a
thunderstorm surged across Melbourne, carrying pollen that strong winds
and rain broke into tiny fragments. Perennial ryegrass seeds were swept
up in whorls of wind and carried from four million hectares of
pasturelands (about 9.9 million acres) that lie to Melbourne’s north and
west. If broken into fragments, they are so fine that they can be
inhaled..." (Image credit: UK Daily Record).

11 Ways The Atmosphere Went Bonkers This October That You Probably Didn't Notice. Here's an excerpt and a partial list from a story at Yahoo! Finance: "...Each month, the National Oceanic and Atmospheric Association (NOAA) releases a list of some of the most significant trends in the climate from the past month. Here are some of the most drastic things that took place this October:
- The global average temperature was 1.31 degrees Farenheit above the 20th-Century average of 57.1 — tied with 2003 for the third hottest October ever recorded.
- In the Arctic, 980,000 square miles of sea ice (an area larger than Texas and Alaska combined) went missing. That left Earth with a whopping 28.5% less Arctic ice than the 1981-2010 average, or the lowest levels ever recorded.
- The Antarctic saw sea ice levels that were 290,000 square miles below average — 4% below the 1981-2010 average, or the second-lowest October ever.
- The continental US experienced its third-warmest October in the 122-year record.
- Alaska experienced its driest October since records began in 1925.
- Finland experienced its driest October since national records began in 1961 and Norway experienced its fourth-driest since records began in 1900..."
Map credit: "An image from the 1951 Compendium of Meteorology showing front activity, based on Bjerknes’ model." Internet Archive/Public Domain

Photo credit: "A female Aedes aegypti mosquito feeds from a researcher at Rockefeller University." (Alex Wild).

Clean Energy Gains Ground - But Old Dirty Habits Die Hard. Here's the intro from Reuters: "Solar power is becoming so cheap so fast that in Abu Dhabi it's now less costly to produce a unit of energy from the sun than from oil, leading energy experts said this week. But that doesn’t mean a global switch to renewable energy will be inevitable or speedy, they told a London conference. Difficult and sometimes unexpected problems still stand in the way, including pension funds heavily invested in fossil fuels, upfront costs for clean power, political flip-flops in key nations, and the lobbying prowess of old energy companies..."
Wind Surges To Nearly 15 Percent of Texas Power Supply. Greentech Media has the story: "Texas grid operator ERCOT announced a new record for wind on Monday. For the first time, wind provided more than 15,000 megawatts of electricity to the state on a single day. The record wind on Sunday supplied an average of 41 percent of electricity throughout the day. But it was not an all-time record for wind in Texas. On one day in March, wind supplied more than 48 percent of load during one hour. It is not the hour-by-hour records that are impressive, however. Texas is already the clear leader in wind power in the U.S., and that lead is widening..."

See What People of 1967 Imagined The World Would Be Like in 1999. Is this a young Bill Gates pondering Windows back in the 60s? Wait, my PC still looks like this, come to think of it. The video from Atlas Obscura is worth checking out. As Yogi Berra said: forecasts are hard, especially about the future: "...This short film, produced in 1967 by the Philco-Ford Corporation, a maker of battery-powered tech, imagines the distant future of the year 1999. Amid all the mid-century-modern set dressing, they actually got a lot of things right. In this “society of tomorrow,” we can see precursors to personal computers, email, FaceTime, podcasts (complete with the 2x speed feature), online shopping, 3D imaging and more..."

TODAY: Clouds, few flakes. Winds: NW 8-13. High: 38
THURSDAY NIGHT: Mostly cloudy. Low: 29
FRIDAY: More clouds than sun, a dry sky. Winds: NW 7-12. High: 37
SATURDAY: Peeks of sun, better travel day of the weekend. Winds: S 5-10. Wake-up: 24. High: 38
SUNDAY: Icy mix possible AM hours. Gray sky. Winds: W 8-13. Wake-up: 30. High: 38
MONDAY: Cloudy, breezy and milder. Winds: SE 10-20. Wake-up: 29. High: 44
TUESDAY: Cold rain or mix, mainly wet roads. Winds: SE 8-13. Wake-up: 33. High: near 40
WEDNESDAY: Cloudy, colder. Snow arrives late PM. Wake-up: 28. High: 32
Climate Stories...
The Crops of the Future. Climate change, population growth - how will macro trends impact the crops we need to sustain the world and avoid widespread famine and dislocation? Here's an excerpt of an article at TakePart: "...But before doomsday, there’s just today—and plant breeders have plenty of work to do. Across the globe, scientists and breeders working at the seed banks that have been duplicated at Svalbard have a laborious job: making sure the world can continue to grow enough food no matter what curve balls climate change throws our way. Agriculture faces a tall order: Maintain food security as the population rises by an additional 3 billion people by 2050, requiring an estimated 60 percent increase in global food production. Farmers are already grappling with increased instances of drought, floods, and record heat waves, not to mention degraded soil. “We seem to be entering a period of relatively unstable climate, and that’s the hardest thing to breed for," said Matthew Reynolds of the International Maize and Wheat Improvement Center. “It’s exciting [work], but a lot of people’s food security depends on it, which makes it urgent...” (Photo credit: Rob Koch).
Photo credit: "Quark Expedition guides stand on the shore of Paulet Island, near the tip of the Antarctic Peninsula, as a pair of inflatable dinghies maneuver through icebergs. Climate scientists are keeping a close eye on Antarctica’s coastal ice masses, as a warming ocean threatens to destabilize huge sections of the cryosphere in this region. According to some recent studies, the warming could reach a tipping point that would result in several feet of global sea level rise by the end of the century." (Photo: Bob Berwyn)
A Wrenching Choice For Alaskan Towns In The Path of Climate Change. America has already seen its first climate refugees, in Louisiana and Alaska. Here's an excerpt from The New York Times: "...With
its proximity to the Arctic, Alaska is warming about twice as fast as
the rest of the United States and the state is heading for the warmest
year on record. The government has identified at least 31 Alaskan towns
and cities at imminent risk of destruction, with Shaktoolik ranking
among the top four. Some villages, climate change
experts predict, will be uninhabitable by 2050, their residents joining
a flow of climate refugees around the globe, in Bolivia, China, Niger
and other countries. These endangered Alaskan communities face a choice.
They could move to higher ground, a wrenching prospect that for a small
village could cost as much as $200 million. Or they could stand their
ground and hope to find money to fortify their buildings and shore up
their coastline..."
Photo credit:
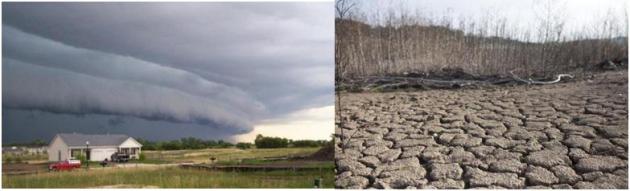

Photo credit: "Pope Francis greets Stephen Hawking (R), theoretical physicist and cosmologist, during a meeting with the Pontifical Academy of Sciences in Vatican, November 28, 2016." Osservatore Romano/Handout via Reuters.
No comments:
Post a Comment