-14 F. morning low St. Cloud Thursday.
1 F. high temperature yesterday.
24 F. average high on December 15.
31 F. high on December 15, 2015.
December 16, 1972: Fairmont has its fifteenth consecutive day with lows at or below zero degrees Fahrenheit.
December 16, 1940: A snowstorm hits much of Minnesota. Water equivalent of the snow was 1.27 inches at Winona.
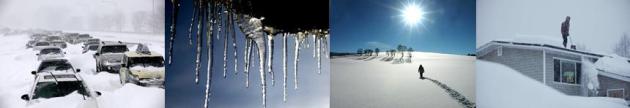
Wicked Cold - But First White Christmas in 3 Years
It's a Charles Dickens December; the best of times, the worst of times. Now before you diagnose my brain-freeze let me explain.
For snow lovers these are the best of times. A real winter! No more excuses why it won't snow. El Nino? El Schmeeno!! This will be the first white Christmas since 2013, when we woke up to 9 inches on December 25. This year we may easily have a foot for Santa's arrival. Odds now favor average snowfall the rest of the winter, maybe 50-60 inches by late March. Finally.
If you don't like snow take heart: Minnesota's coldest days tend to be sunny, which removes much of the psychological sting. And the sun is now setting LATER every evening. In roughly a month average temperatures creep up again. The trend is for spring to arrive earlier. This premature spasm of January will pass.
Winter Storm Warnings mean treacherous travel is imminent; I expect 5-10 inches of powder, maybe a foot south of the downtowns. All that snow will be compressed into ice, leading to hideous conditions on area highways.
20s and 30s next week should feel like a (bad) vacation!
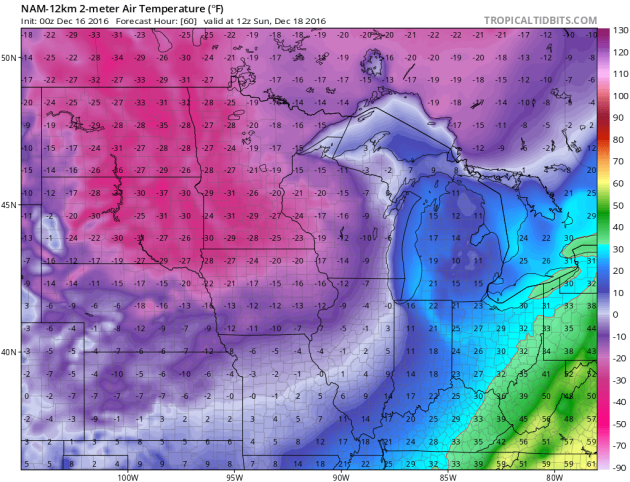
Sunday morning predicted air temperature: NOAA NAM and Tropicaltidbits.com
An Expansive Storm. From heavy rain and blizzard conditions over California's Sierra Nevada range to a couple feet for Colorado ski resorts to nearly a foot from the Twin Cities to Milwaukee, to traffic-snarling snows over the Great Lakes and New England, the storm tracking across the USA will insure a white Christmas for roughly the northern half of the USA. 12 km NAM Future Radar: Tropicaltidbits.com.
* Long-duration snowstorm likely from the Rockies and South Dakota into Minnesota, Wisconsin and the Great Lakes from Friday into Saturday; potential for up to a foot of powdery snow.
* Heavy lake effect snows continue for Buffalo, Rochester and Syracuse with 2-3 foot totals by the weekend.
* Band of icy precipitation likely from Missouri into the Ohio Valley this weekend.
* High Wind Warnings posted for New York and Boston; winds gust over 60 mph tonight and early Friday.
* Dangerously cold air temperatures and wind chills for the Upper Midwest by Sunday; coldest in 3 years with air temperatures near -20 and a chill factor of -30 to -40.


Summary: The coldest air in 3 years will push into the Upper Midwest by Sunday, preceded by a smear of heavy snow and ice, capable of disrupting travel and facility operations from the Dakotas and Upper Midwest into the Great Lakes, Ohio Valley and New England. Up to a foot of snow will slow things down from the Twin Cities to Milwaukee; lake effect snows burying much of upstate New York under 2-3 feet of additional snow. And winds tonight will be howling across southern New England. The cruel winds of January are blowing prematurely this year, and it should result in more snow, ice and cold than the past 2 winters across much of the USA. We'll keep you posted.
Paul Douglas, Senior Meteorologist, AerisWeather
Winds Gust to 106 mph in California's Sierra Nevada. SFgate.com has the details.
Flooding and Mudslides in the Bay Area. Details from KGO-TV.
Oil and Gas Industry Back In Favor in Washington D.C. The Washington Post reports: "After eight years of being banished and sometimes vilified by the Obama administration, the fossil fuel industry is enjoying a remarkable resurgence as its executives and lobbyists shape President-elect Donald Trump’s policy agenda and staff his administration. The oil, gas and coal industries are amassing power throughout Washington — from Foggy Bottom, where ExxonMobil chief executive Rex Tillerson is Trump’s nominee to be secretary of state, to domestic regulatory agencies including the departments of Energy and Interior as well as the Environmental Protection Agency..."
Photo credit: "The Valero refinery glows in the dusk light in Port Arthur, Tex." (Michael S. Williamson/The Washington Post).
Graphic credit: "Disclosed capex for onshore wind and PV projects in 58 non-OECD countries." Source: Bloomberg New Energy Finance.

Photo credit: "Renewable energy sources, which include wind, solar and hydroelectric, account for 22 percent of Willmar’s power load. Wind turbines produce just a small portion of that." Briana Sanchez / Tribune file photo.

Biggest Tech Failures and Successes of 2016.
Yes, but how will this impact my AOL account? And can I find anyone to
give me a fair price for my CB radio and 8-Track player? Here's an
excerpt from The New York Times: "If
you love technology, it may be time for a group hug: This year has been
rough for consumer technology. From exploding smartphones and
hoverboards to the proliferation of fake news on social media, many of
our tech hardware, software and web products suffered embarrassing
failures. Behemoths like Google, Facebook and Samsung Electronics were
on the firing line as a result. Yet the year was not entirely bleak.
There were major strides in several areas of consumer tech, including
Wi-Fi, virtual reality and encryption. What follows is a year in review
on the tech that needed the most fixing, and the tech that was actually
fixed in 2016..."
Who Sold The Most CD's in 2016? It Wasn't Drake, Kanye or Beyonce. Take a bow, Amadeus! Here's an excerpt from Atlas Obscura: "The artist who sold the most CDs in 2016 hasn’t toured in over 200 years, but is still more famous than Drake. According to a report on Billboard,
Wolfgang Amadeus Mozart made a massive comeback this year with a
career-spanning box set that left other CD sales look weak in
comparison. Released in October, Mozart 225: The New Complete Edition is
a 200-disc collection of Mozart’s entire musical catalogue. From his
symphonies to his concertos, down to little scraps and fragments of his
work, the set is one of the most comprehensive collections of Mozart’s
music ever released. And at just over $300, it’s not even that expensive
(considering the amount of music it contains)..."
Image credit: "Jealous?" Johann Nepomuk della Croce/Public Domain
TODAY: Winter Storm Warning. Snow likely. Icy roads. Winds: SE 8-13. High: 15
FRIDAY NIGHT: Snow continues, treacherous travel. Low: 4
SATURDAY: 5-10" snowfall totals, maybe a foot southern suburbs. Snow tapers to flurries. Winds: NW 10-20. High: 5 (falling)
SUNDAY: Coldest air in 3 years. Feels like -40F early. Winds: W 8-13. Wake-up: -22. High: -2
MONDAY: Mostly cloudy, not as nasty. Winds: SW 10-20. Wake-up: -4. High: 23
TUESDAY: Clipper arrives with more flurries. Winds: W 15-25. Wake-up: 20. High: 33
WEDNESDAY: Peeks of sun, better travel. Winds: SE 5-10. Wake-up: 18. High: near 30
THURSDAY: Intervals of sun, grilling weather. Winds: W 8-13. Wake-up: 21. High: 31
* Photo credit parhelia, with 22-degree halo and "sun dogs" courtesy of AerisWeather meteorologist Todd Nelson.
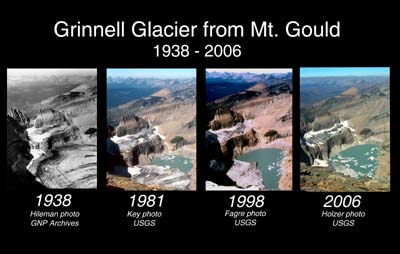
Climate Stories...
The Best Climate Graphics of the Year. Visualizing what's happening in ways that are easy to comprehend is non-trivial, and mission-critical. Here's an excerpt from Vox: "Here
at Vox, we’re big fans of clever graphics and visualizations that make
climate change, which can sometimes seem abstract and impenetrably
complex, easier to grasp. We’ve highlighted several this year (see here, here, and here),
more than one of them from University of Reading climate scientist Ed
Hawkins, who seems to have a real eye for these things. Helpfully,
Hawkins has rounded up his own favorite climate visualizations from the
year in one place — graphics showing the rise in temperatures, the rise
in CO2 concentrations, the melting of Arctic ice, and more. So without
further ado, here are the coolest, most visually arresting ways of
understanding just how screwed we are. Thanks, 2016..."

Climate Denial Stages a Roaring Comeback. InsideClimate News has the story.
Tell Investors of Climate Risks, Energy Sector Is Urged. Here's a clip from The New York Times: "A coalition of the world’s most powerful bankers, regulators and even executives at some heavy polluters have a message for oil and gas companies: Be more forthcoming about the risks posed by climate change. The new guidelines, issued on Wednesday by a task force commissioned by the Group of 20
richest nations, are some of the most comprehensive about how companies
should measure and disclose the predicted effects of extreme weather
and rising seas. These recommendations come at a tough time for climate
advocates, still reeling from the prospect of a presidential
administration in the United States hostile to steps to address climate
change. With little prospect for new rule making in the United States
and slow progress elsewhere, the task force urged corporations to
disclose climate risks voluntarily..."
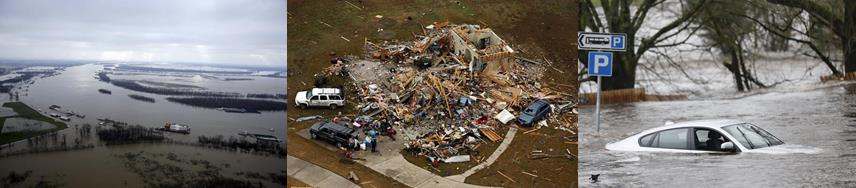
Climate Change Brewing More Extreme Weather, Shifting Breaking Points. Ars Technica has the article; here's an excerpt: "...As for what's ahead, the researchers wanted to use their model to understand the environment's “breaking point”—the temperature above which the precipitation rate stops increasing and starts to decline. The concept was not well understood before, but the researchers wanted to know whether global warming may shift this breaking point. According to their model—which assumes that future weather patterns look more or less like current and past weather patterns—extreme precipitation events in the future “are projected to significantly increase in almost all North American land regions,” the authors write in their paper. That’s because climate change creates warmer and moister environments, which in turn produce more extreme precipitation events—shifting the “breaking point...”
Climate Change Forced Over 1 Million Africans From Their Homes in 2015. Here's an excerpt from ThinkProgress: "At
least 12 million people lived in ongoing displacement caused by
conflict, violence, and other disasters across the African continent in
2015. And in the future, climate change may be the lead driver of even
greater displacement. In the Africa Report on Internal Displacement — a
new report by the Internal Displacement Monitoring Centre that focused
on internal displacement across the entire African
continent — researchers found that “disasters triggered by rapid-onset
natural hazards” forced 1.1 million people from their homes across 33
African countries last year. What’s more, disaster-induced displacement
makes people more vulnerable from one year to the next and more
susceptible to food insecurity since planting and harvesting become
disrupted when farmers are absent..."
Photo credit: "Fishermen transport villagers with their belongings across floodwaters in Phaloni, southern Malawi, Jan 22, 2015." CREDIT: AP Photo/Shiraaz Mohamed.
No comments:
Post a Comment