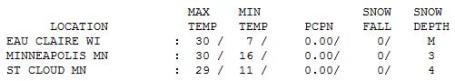
29 F. high temperature on Saturday (4:57 pm).
43 F. average high for March 26.
53 F. high temperature on March 26, 2010.
79 F. record high set on March 26, 2007 in St. Cloud
4" snow left on the ground in STC.
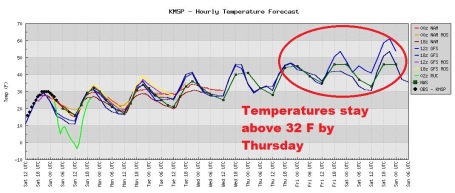
* Nighttime lows rise above freezing by Thursday - snow melt accelerates late in the week with highs topping 50 by Friday and Saturday of this week.
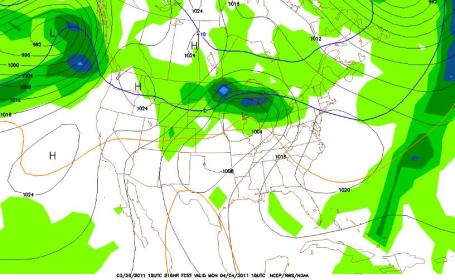
* Storm track stays well south of Minnesota - stormier, wetter pattern returns the first week of April.
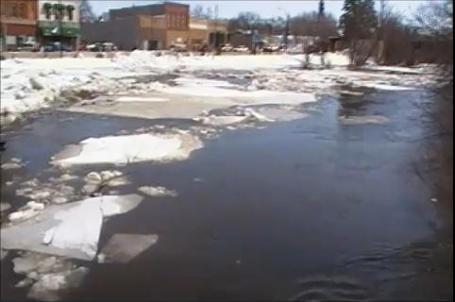
Ice Jam. Thanks for Philip Kern, City Administrator in Delano, for sending me this
YouTube footage of an ice dam forming on the Crow River in Delano on Friday. These dams form quickly, spontaneously - are virtually impossible to predict - capable of causing rapid rises in water levels upstream of the dam.
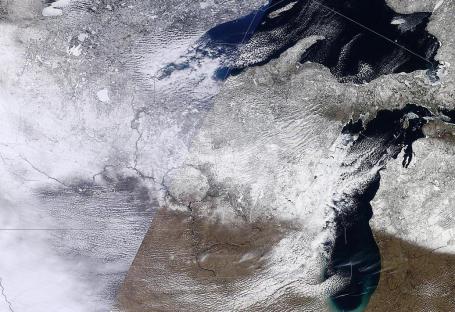
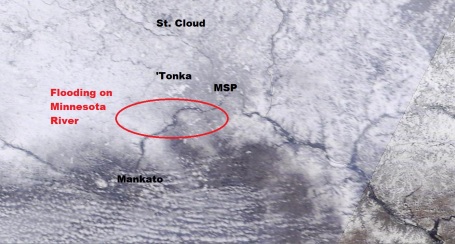
Lingering Snowcover. Saturday's high-resolution NASA "MODIS" Terra satellite orbiting about 200 miles above Minnesota snapped this shot - showing significant snow on the ground from the northern and western suburbs of the Twin Cities into central and northern Minnesota. The latest image is
here.
Metro Close-Up. This 250 meter resolution image of the Twin Cities Saturday shows bare ground over the far southern suburbs (Northfield, Rosemount), while significant snow remains on the ground over the northern, eastern and western suburbs of the Twin Cities. The immediate metro area shows up as gray (more asphalt, highways, fewer areas for snow to collect).
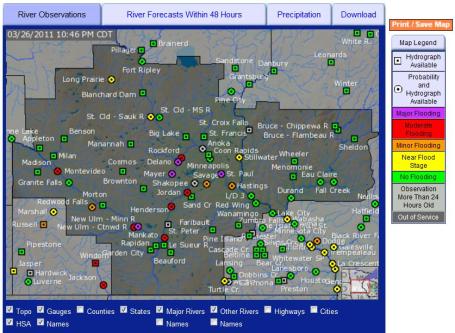
Flood Update. NOAA's Advanced Hydrological Prediction Service makes real-time conditions and forecasts available for all of Minnesota's rivers and streams. All those purple markers on the map denote major flooding now underway, in Rockford and Delano (Crow River), the Cottonwood River at New Ulm (water levels now reclining), and on the Mississippi River in St. Paul. Click
here for the latest information.
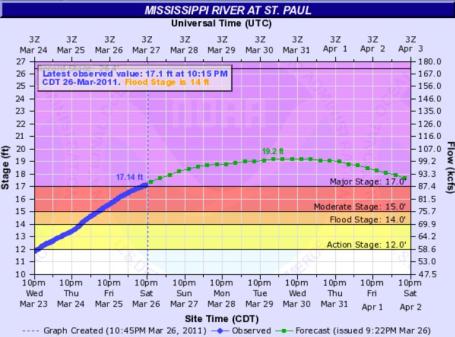
Major Flooding in St. Paul. The latest
crest forecast calls for 19.2 feet Tuesday or Wednesday, more than 2 feet above major flood stage. River levels on the Mississippi are forecast to begin to slowly drop by the weekend. Dry weather lingers into next Saturday, but temperatures will remain above freezing by Thursday, accelerating snow melt. There is still considerable snow from the northern suburbs of the Twin Cities into northern Minnesota.
Warming Trend. The models are unanimous - we will finally warm up this week, highs in the 40s by Tuesday, 50 possible as early as Thursday, temperatures surging well into the 50s by Friday and Saturday. The good news: the warm-up will not be accompanied by significant rain for at least the next 7 days.
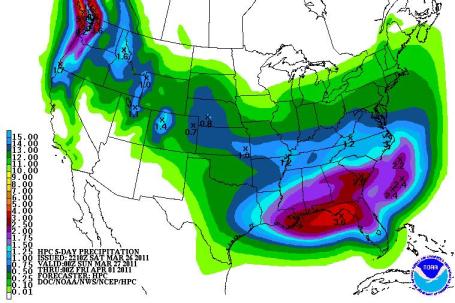
Catching A Huge Break. The QPF (qualitative precipitation forecast) calls for dry weather across Minnesota and most of Wisconsin through the end of the week, a southward shift in the storm soaking the Deep South. There are signs of stormier, wetter weather returning the first week of April.
Next Chance of Significant Precipitation? Dry weather prevails all week; the next chance of rain roughly a week from Monday as the storm track shifts northward again, allowing moisture from the Gulf of Mexico to flow northward.
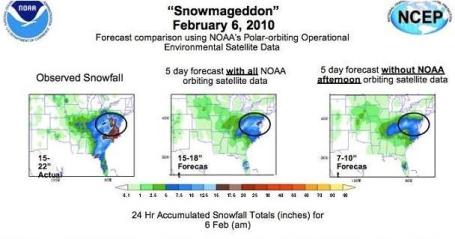
Big Errors In Snow Forecast Possible Result of NOAA Budget Cuts. The $400 million plus budget cut proposed for NOAA may turn out to be more than just a minor inconvenience (if implemented). One of the items on the chopping block: the low-orbiting (POES) weather satellites, which are used to "initialize" the weather models meteorologists use. So what? Take away these satellites and the quality of the weather models degrades rapidly over time. Doug Hill and Bob Ryan (2 TV meteorologists I have immense respect for in the industry) write about the implications in their WJLA-TV
blog: "
Are you the type of person who gets really angry when your local forecaster is off on snow totals by two inches? Well, how pissed would you be if the forecaster missed the target by 10 inches? That magnitude of forecasting error could start happening soon, according to a wonky-but-important article by meteorologist Dan Satterfield at the American Geophysical Union. Satterfield has penned a good explanation of why everyone should be concerned about the looming budget slashing for the National Oceanic and Atmospheric Administration. If you haven’t been following it, the story in brief is that House Republicans have approved a $410 million reduction for NOAA, the agency that runs the National Weather Service and many other weather data-collection organizations. While recent criticism of the cut has focused on potential harm to the nation’s network of tsunami sensors, Satterfield notes a higher-up issue – literally. The proposed budget lacks funding for NOAA’s polar-orbiting satellites, which are creaky and not expected to last. These satellites are crucial for keeping watch on the “black holes” of the earth where normal weather-sensing equipment (like balloons) does not go. He says:
First of all, these satellites are not the images you see on most TV weathercasts, they are at a much lower (870 km) altitude and actually have a much better view of storm systems. Most importantly, they have instruments that allow the temperatures and winds in the atmosphere to be measured over wide areas including the oceans, where very few weather observations exist. Modern forecasting relies very heavily on numerical weather prediction models that simulate the atmosphere out to about 10 days and you must give these models as accurate an initial condition as possible. In other words, GIGO: garbage in=garbage out."
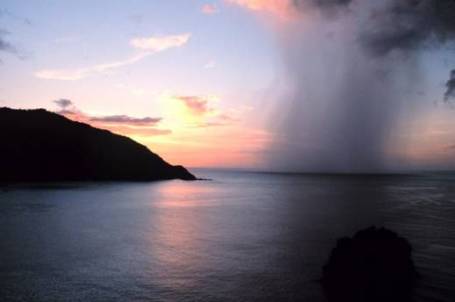
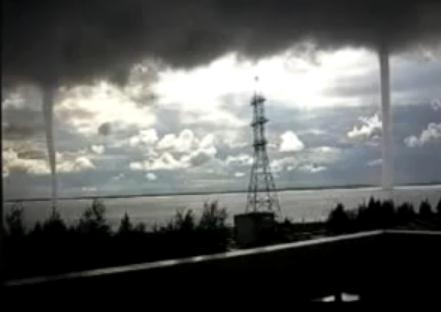 Dueling Tornadoes
. This unusual sight shows a pair of waterspouts near Surgut, Russia. The YouTube footage is
here.
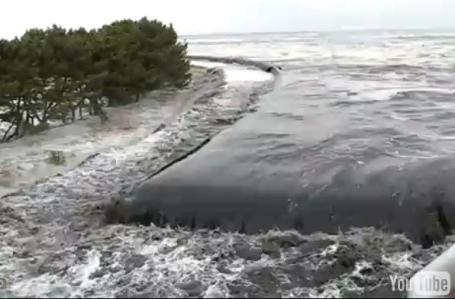
Surreal Sight. This YouTube
video from boingboing.com shows the raw power of water engulfing this harbor town, wave after wave of towering water slamming against the shoreline. Bottom line: if you're ever on the coast and the water recedes (leaving behind the bottom of the harbor and flopping fish) - it's time to head to high ground: "
This eyewitness video of the March 11 tsunami striking Japan shows how, in under 10 minutes, a harbor in Oirase Town, Aomori Prefecture goes from business as usual to, well, gone. While other videos have shown massive destruction or endless floods, this one shows a huge dry area that completely fills with water, making it easy to see just how much water was being pushed around. It's so hard to believe this actually happened. The guy filming it must have been scared to death."
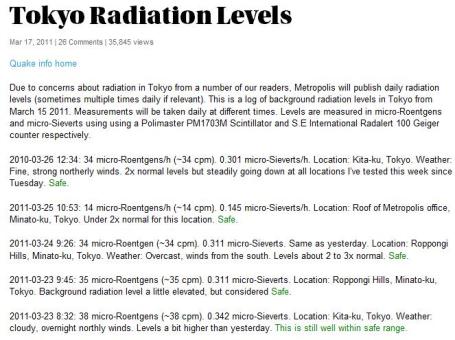
Perspective. It's hard to complain too loudly about the chilly temperatures (and naggins snow cover), when residents across Japan are tracking plumes of radiation on the nightly news. The Japanese site, "
Metropolis" is providing hourly updates on radiation levels in Tokyo. The worst fear is fear of the unknown - not knowing if the air you're breathing is full of potentially dangerous contaminents. I can't even begin to imagine what it must be like to be in Japan right now, wondering which way the wind will blow tomorrow, whether your home will be downwind of these leaking nuclear reactors: "
Due to concerns about radiation in Tokyo from a number of our readers, Metropolis will publish daily radiation levels (sometimes multiple times daily if relevant). This is a log of background radiation levels in Tokyo from March 15 2011. Measurements will be taken daily at different times. Levels are measured in micro-Roentgens and micro-Sieverts using using a Polimaster PM1703M Scintillator and S.E International Radalert 100 Geiger counter respectively."
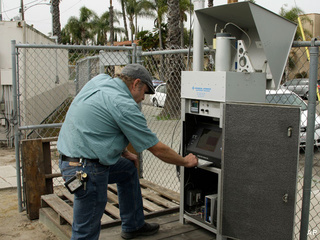
Gaps In U.S. Radiation Monitoring System Revealed. The Wall Street Journal has a troubling
article about the monitoring system that tracks radiation levels in the USA. Why weren't they working properly in the wake of Japan's nuclear disaster? "
SAN FRANCISCO — Part of the nation's key radiation warning system was out of service as the U.S. braced for possible exposure to the fallout from a nuclear crisis in Japan. While no dangerous levels of radiation have reached American shores, the test of the monitoring network has spurred some lawmakers to question whether it can adequately safeguard the country against future disasters. The system is crucial because federal officials use the monitors' readings to validate the impact of nuclear incidents, then alert local governments and the public. In California, home to two seaside nuclear plants located close to earthquake fault lines, federal officials said four of the 11 stationary monitors were offline for repairs or maintenance last week. The Environmental Protection Agency said the machines operate outdoors year-round and periodically need maintenance, but did not fix them until a few days after low levels of radiation began drifting toward the mainland U.S.
About 20 monitors out of 124 nationwide were out of service earlier this week, including units in Harlingen, Tex. and Buffalo, N.Y. on Friday, according to the EPA. Gaps in the system — as well as the delays in fixing monitors in some of Southern California's most populated areas — have helped to prompt hearings and inquiries in Washington and Sacramento."
Cell Phones Track Your Every Move, And You May Not Even Know. If you're paranoid to begin with do NOT read this
article. The New York Times has an article about the GPS-tracking capabilities of smart phones. Yes, in the wrong hands knowing PRECISELY where you are at any given moment of the day could be problematic: "
A favorite pastime of Internet users is to share their location: services like Google Latitude can inform friends when you are nearby; another, Foursquare, has turned reporting these updates into a game. But as a German Green party politician, Malte Spitz, recently learned, we are already continually being tracked whether we volunteer to be or not. Cellphone companies do not typically divulge how much information they collect, so Mr. Spitz went to court to find out exactly what his cellphone company, Deutsche Telekom, knew about his whereabouts. The results were astounding. In a six-month period — from Aug 31, 2009, to Feb. 28, 2010, Deutsche Telekom had recorded and saved his longitude and latitude coordinates more than 35,000 times. It traced him from a train on the way to Erlangen at the start through to that last night, when he was home in Berlin."
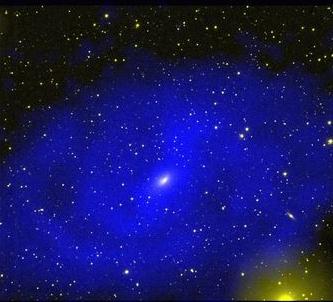
Hundreds Of Invisible "X-Galaxies" Predicted Orbiting The Milky Way. Daily Galaxy has a pretty mind-blowing
article here. Galaxies with no stars? I'm confused (which isn't an unnatural state for yours truly). I'm continually amazed by the depths of our (overall) ignorance when it comes to the universe all around us. As our tools improve (whether we're studying the human genome or dark matter billions of light years from Earth) our discoveries increase at an exponential rate - like peeling away layers of the onion, the universe is revealing more and more about itself - and we look on in wonder: "
The outer edges of the Milky Way's appear to be orbited by innumerable invisible galaxies, one of which appears to be crashing into our own. Back in 2005 astronomers discovered the first evidence of mysterious dark galaxies with no starlight - VIRGOHI 21 - a mysterious cloud of hydrogen in the Virgo Cluster 50 million light-years from the Earth found to be colliding with our galaxy - revealed its existence from radio waves from neutral hydrogen coming from a rotating cloud containing enough hydrogen gas to spawn 100 million stars like the sun and fill a small galaxy. The rotation of VIRGOHI21 is far too fast to be consistent with the gravity of the detected hydrogen. Rather, it implies the presence of a dark matter halo with tens of billions of solar masses. Given the very small number of stars detected, this implies a mass-to-light ratio of about 500, far greater than that of a normal galaxy (which would be around 50). The large gravity of the dark matter halo in this interpretation explains the perturbed nature of the nearby spiral galaxy NGC 4254 and the bridge of neutral hydrogen extending between the two entities. VIRGOHI21 proved to be the first discovery of the dark galaxies anticipated by simulations of dark-matter theories. Although other dark-galaxy candidates have previously been observed, follow-up observations indicated that these were either very faint ordinary galaxies or tidal tails. A dark galaxy is an area in the universe containing a large amount of mass that rotates like a galaxy, but contains no stars, held together by dark matter. Without any stars to give light, it could only be found using radio telescopes. It was first seen with the University of Manchester's Lovell Telescope in Cheshire, and the sighting was confirmed with the Arecibo telescope in Puerto Rico."
 Guilty Dog
. O.K. This YouTube
clip is all over the Internet, but if you somehow missed this video it's worth watching - one of the funnier things I've seen recently. Who says man's best friend doesn't have human-like feelings (and expressions?) The look on that (poor) dog's face at the end of the clip is priceless. You might want to watch it with your favorite pet. Video courtesy of Jimmy Kimmel Live.
 This Is Late March?
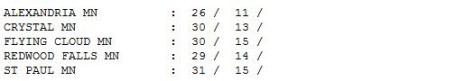
 Saturday's high of 30 in the Twin Cities is the average high for February 15. In spite of bright sun temperatures were 15 degrees cooler than average. In spite of sub-freezing temperatures the amount of snow on the ground shrank an inch, down to 3" at MSP (the result of some melting and compaction of snow).
St. Cloud is reporting 4" on the ground. Eau Claire residents woke up to a chilly 7 F. Saturday morning.
 Paul's SC Times Outlook for St. Cloud and all of Minnesota:
TODAY
Paul's SC Times Outlook for St. Cloud and all of Minnesota:
TODAY: Blue sky, feels like early March. Winds: E 10. High: 30 (average high is 44).
SUNDAY NIGHT: Partly cloudy, unusually chilly for late March. Low: 15
MONDAY: Fading sun, clouds increase. High: 33
TUESDAY: Storm passes south, cloudy skies (wet snow may brush far southern MN). Low: 24. High: 37
WEDNESDAY: Intervals of sun, milder. Low: 27. High: 44
THURSDAY: Mix of clouds and sun, not bad at all. Low: 29. High: 49
FRIDAY: Partly sunny, feels like spring again! Low: 33. High: 53
SATURDAY: Risk of spring fever, fading sun. Low: 35. High: 54
Getting Better
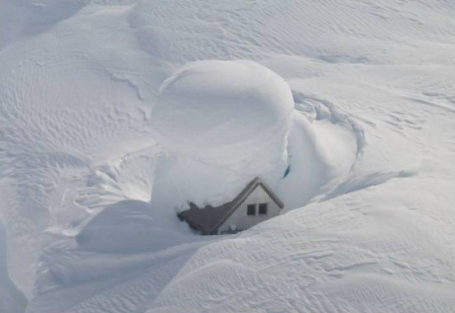
Have you fallen into a dark, spring funk? You're not alone. It's been a tough winter season, no question: 84.7" snow, the 5th largest snowfall in modern-day records, the most snow in 27 years. We are weary, yet things could have been worse.
No debilitating ice storms. Fewer subzero nights than average (18 vs. 28). We're still not seeing the volume of sustained, subzero nights we endured in the 60s and 70s. Based on heating degree days the winter heating season (since September of 2010) is running 3% WARMER than average.
This chilly spell is acting as a "brake" on snow melt, taking the edge off of river flooding for the time being. But NOAA officials remain very concerned about the long-term potential for flooding. We've been stuck in an unusually stormy pattern since last year. If we see 60s (coupled with a few inches of rain) in April, the flood threat will spike once again. Their message: remain vigilant; this isn't over yet.
Cool sun lingers today, a slow warming trend as the week goes on. 50s return by late week, even an outside shot at 60 next Saturday. Tuesday's storm stays south of Minnesota, but the 1st week of April looks stormier (rain, possible wet snow). Ugh.
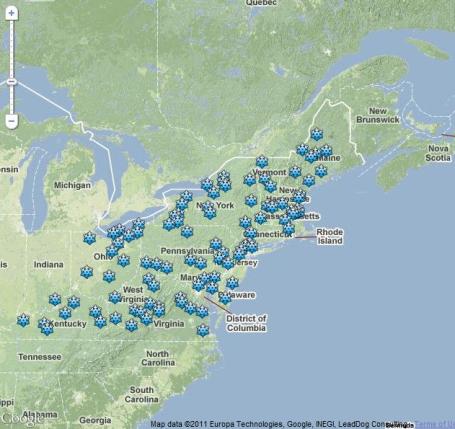
Northeast Snowfall Trends. Climate Central has an article focused on the question: "has snowfall in the northeast truly increased in recent years?" Here's an excerpt: "
The past two winters have been extraordinarily snowy in parts of the Northeast and Mid-Atlantic. But exactly how snowy has it been? And how much snow can the region expect in future decades if the climate continues to warm? You can use the (interactive map) to find out. The first is an (graphic) with weather stations represented by snowflakes. Click on one to see the total winter snowfall for that location for each of the past 31 years. The average yearly snowfall during the past three decades at each location is shown by the gray line, and projected average annual snowfall at the end of the century by the red. (See the caveats on this calculation further down in this post)."
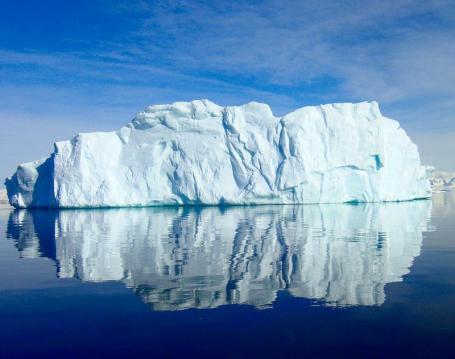 Antarctic Icebergs Play Key Role In Climate Change
. Here's a recent article from the Business Standard: "
Scientists have discovered that when Antarctic icebergs cool and dilute the seas through which they pass for days, they also raise chlorophyll levels in water, thus increasing carbon dioxide absorption in ocean. An interdisciplinary research team supported, by the National Science Foundation, claims the finding has global implications for climate research, the 'Nature Geoscience' journal reported. The research indicates that ordinary icebergs are likely to be more prevalent in Southern Ocean, particularly as the Antarctic Peninsula continues a well-documented warming trend and ice shelves disintegrate. It also shows that these ordinary icebergs are important features of not only marine ecosystems, but even of global carbon cycling. "These new findings amplify the team's previous discoveries about icebergs and confirm that icebergs contribute yet another, previously unsuspected, dimension of physical and biological complexity to polar ecosystems," said Roberta L Marinelli, Director of the NSF's Antarctic Program. The latest findings document a persistent change in physical and biological characteristics of surface waters after the transit of an iceberg, which has important effects on phytoplankton populations, clearly demonstrating "that icebergs influence oceanic surface waters and mixing to greater extents than previously realised, said Ronald Kaufmann of University of San Diego. The researchers studied the effects by sampling the area around a large iceberg more than 32 kilometers (20 miles) long; the same area was surveyed again ten days later, after the iceberg had drifted away."
Climate Change Can't Be Stopped, But We Will Adapt. Chris Berg tackles the topic of adaptation in
this story in the Sydney Morning Herald: "
Julia Gillard is half-right. The world is acting on climate change. But not acting to stop it - to adapt to it. In the 1920s, an average of 240 people out of every million died every year from extreme weather events: drought, flood, windstorm, landslide, earthquake, extreme temperatures and wildfire. According to data from the International Disaster Database, last decade that figure dropped to just three per million. Actually, the numbers are even better than they first look. The 20th century saw a 99.9 per cent reduction in the risk of death from drought. And the risk of death from floods came down almost as much: 89 per cent. Floods and drought - two of the most commonly mentioned consequences of climate change. We're getting much better at managing and surviving them. The causes of this remarkable decline in mortality are many. Better transport and communications help move food to where it's needed, quicker. Globalised trade gives producers an incentive to do so. Hardy modern agriculture can survive not just long-term climatic shifts, but the more pressing problem of bad growing seasons. Better flood control and prevention, weather forecasting and more responsive emergency services all help reduce the damage from floods. Never have we been better at protecting ourselves against nature."
No comments:
Post a Comment