59 F. high in St. Cloud on Wednesday.
39 F. average high on November 16. You remember average, right?
51 F. high on November 16, 2015.
November 17, 1996: Six inches of snow falls in Douglas, Pope, and Stevens Counties.
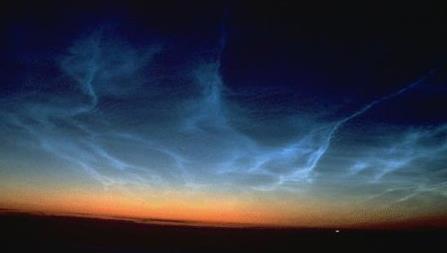
November 17, 1835: A strange night is observed at Ft. Snelling. Northern lights are seen over prairie fires.
Friday Slush for MSP - Blizzard Watch Out WestYesterday
the FedEx guy showed up in shorts and a short-sleeve shirt. "Can you
believe this weather, Paul?" he asked, beaming from ear to ear. I expect
muffled applause to die down by
Friday, as the first big winter storm of the season rolls across the state.
With
a rapidly intensifying storm tracking directly over MSP I don't expect
heavy snow in the immediate metro, but much of northern and western
Minnesota should see a plowable accumulation, whipped into towering
drifts by 45 mph wind gusts. Blizzard Watches are posted for western
Minnesota, where travel conditions could range from treacherous to
impassable by
Friday afternoon.
Roads will be increasingly slushy and icy the farther north and west you travel from MSP
on Friday.
Coming after the warmest start to November on record it will feel like a cold slap across the face.
Skies clear
Saturday with weekend highs in the 30s. Models suggest a light mix
Tuesday night, again
Friday, but no major storms to complicate travel plans.
The first freeze at MSP comes
Saturday, a 221-day frost-free growing season in 2016. Wow.
Blizzard Watch Western Minnesota and Eastern South Dakota.
You may want to think twice about driving into western Minnesota or
toward Watertown, Brookings or Aberdeen, South Dakota on Friday. The
combination of heavy snow and high winds will create treacherous
condiitions. Details:
DOUGLAS-STEVENS-POPE-LAC QUI PARLE-SWIFT-CHIPPEWA-YELLOW MEDICINE-
INCLUDING THE CITIES OF...ALEXANDRIA...MORRIS...GLENWOOD...
MADISON...BENSON...MONTEVIDEO...GRANITE FALLS
307 PM CST WED NOV 16 2016

...BLIZZARD WATCH REMAINS IN EFFECT FROM LATE THURSDAY NIGHT
THROUGH FRIDAY EVENING...

A BLIZZARD WATCH REMAINS IN EFFECT FROM LATE THURSDAY NIGHT
THROUGH FRIDAY EVENING.

* BLIZZARD CONDITIONS ARE POSSIBLE FROM LATE THURSDAY NIGHT
  THROUGH FRIDAY EVENING.

* WINDS GUSTING AS HIGH AS 60 MPH COULD CAUSE WHITEOUT
  CONDITIONS IN BLOWING SNOW. SIGNIFICANT DRIFTING OF THE SNOW
  IS LIKELY.

* TOTAL SNOW ACCUMULATIONS OF 2 TO 9 INCHES ARE POSSIBLE...BUT
  SNOW DRIFTS COULD EXCEED TWO TO THREE FEET IN OPEN COUNTRY.

* TRAVEL COULD BE VERY DIFFICULT TO IMPOSSIBLE...INCLUDING
  DURING THE MORNING COMMUTE ON FRIDAY.
NAM/WRF Solution.
Here is NOAA's high-resolution 4km model, showing the axis of heaviest
snow from eastern South Dakota to Bemidji and International Falls; as
much as 12-18" of snow predicted. Map credit: WeatherBell.
GFS Solution.
NOAA's GFS solution shows the heaviest snow band farther north than the
NAM/WRF model, some 10-16" amounts from near Fergus Falls and Bemidji
into the Minnesota Arrowhead.
European Solution.
The ECMWF ("Euro") pulls the axis of heaviest snow into far
southwestern Minnesota; more impressive overall, with 8" predicted for
Brainerd, closer to 12" at Alexandria and a cool 15" for Bemidji. A
coating is possible in the MSP metro, maybe a quick 1-2" on lawns and
fields by late Friday.
Future Radar.
NOAA's 4km NAM model pulls rain into Minnesota Thursday night, changing
over to snow from west to east during the day Friday. By the time the
atmosphere is cold enough for accumulating snow (ground temperatures and
the lowest mile of the atmosphere <32f aerisweather.="" and="" are="" be="" but="" central="" cities.="" cut="" enough="" excited.="" for="" get="" have="" immediate="" in="" know="" loop:="" minnesota="" moisture="" most="" much="" northern="" of="" off="" p="" should="" snow-lovers="" snow="" the="" there="" to="" twin="" very="" western="" who="" will="" you="">
Windblown Friday.
Internal models show winds gusting over 40 mph across much of western
Minnesota Friday, capable of producing white-out conditions from
Marshall and Windom to Alexandria and Wadena. Source: AerisWeather AMP.
Peak Gusts.
Here are a few of the towns that may experience blizzard conditions by
Friday. A blizzard is defined as 35 mph winds (sustained) for at least 3
consecutive hours, capable of producing low visibility, under 1/4 mile.
We could easily have those conditions over much of western and northern
Minnesota Friday.
GFS Loop.
Here's NOAA's GFS solution, suggesting a plowable snowfall across far
western, central and northern Minnesota. The central Rockies and Dakotas
will also pick up enough snow to get snow lovers excited. Animation:
AerisWeather.
Thanksgiving Day Weather.
Here is the European solution, valid midday next Thursday, showing
showery rains for the Mid Atlantic region; maybe a mix for upstate New
York. Heavy rain will push into the Pacific Northwest, but the rest of
the USA looks relatively dry and quiet on Turkey Day. No mega-storms
brewing just yet. Source: WSI.
NOAA: U.S. Snowcover Hits an "All-Time Low" for November. Here's the intro to an explainer at
Engadget: "
Researchers just supplied more evidence that climate change-related temperature increases are having a material effect on the planet. America's National Oceanic and Atmospheric Administration reports
that snow cover in the lower 48 states is the lowest ever recorded for
mid-November. As you can see in the map below, there's very little snow
on the ground in the country -- you'd likely have to climb a mountain to
see it. For contrast, the average snow cover between 1981 and 2010
reached as far south as New Mexico..."
Second Warmest October Cements Hottest Year. Climate Central has an update: "...
But
even La Nina years now are warmer than El Niño years several decades
ago because of the long-term warming caused by carbon dioxide and other
heat-trapping gases emitted into the atmosphere. Because of the
combination of El Niño and manmade warming, 2016 will best 2015 as the
hottest year on record, the third record-warm year in a row, the World Meteorological Organization told delegates at the U.N. climate meeting in Morocco..."
Graphic credit: "
The year-to-date temperature anomaly (through September) using the 1891-1910 baseline."
Smoke From a Siege of Wildfires Spreading Across the Southeastern USA Is Easily Seen From Orbit. Details via
Discover Magazine: "
Spurred
on by intensifying drought, wildfires continue to spread across
portions of the southern United States, sending up palls of smoke that
are easily visible from orbit. In the image above, acquired by the Suomi
NPP satellite on November 12, the thickest plumes are rising from fires
in the southern Appalachians within North Carolina and Georgia. But
smoke from fires in Virginia, Kentucky, Tennessee, and South Carolina is
also visible..."
Image credit: "
Plumes of smoke
from wildfires burning in the southern Appalachians are seen in this
broad view of nearly half of the United States acquired by the Suomi NPP
satellite on November 12, 2016. The smoke plumes are roughly dead
center in the image, almost straight north from Florida. Click on the
image and then click again for extreme closeup views." (Source: NASA Worldview).
43 Large Fires Burning Across USA. Check out the latest statistics from the
U.S. Wildfire Tracker, courtesy of WXshift.
A Heartbreaking Hurricane. Hurricane Katrina is linked to heart attacks many years after the storm, according to an analysis at
Nexus Media: "...
Irimpen
and his colleagues also found that patients were significantly more
likely to have other risk factors for heart attack post-Katrina than
before the hurricane, including coronary artery disease, diabetes, high
blood pressure and high cholesterol. They were also more likely to be
smokers. The researchers found that these patients were more than twice
as likely to abuse drugs, or suffer from a psychiatric disease as their
pre-Katrina counterparts. Moreover, unemployment and lack of health
insurance were significantly more frequent among the post-Katrina
patients, he says. Post-Katrina patients also were more likely to
receive prescriptions for medications to treat heart disease,
cholesterol and hypertension, but were only half as likely to take them
compared to the pre-Katrina group, he says..." (
Image credit: "
New Orleans after Hurricane Katrina". Source: United States Navy)
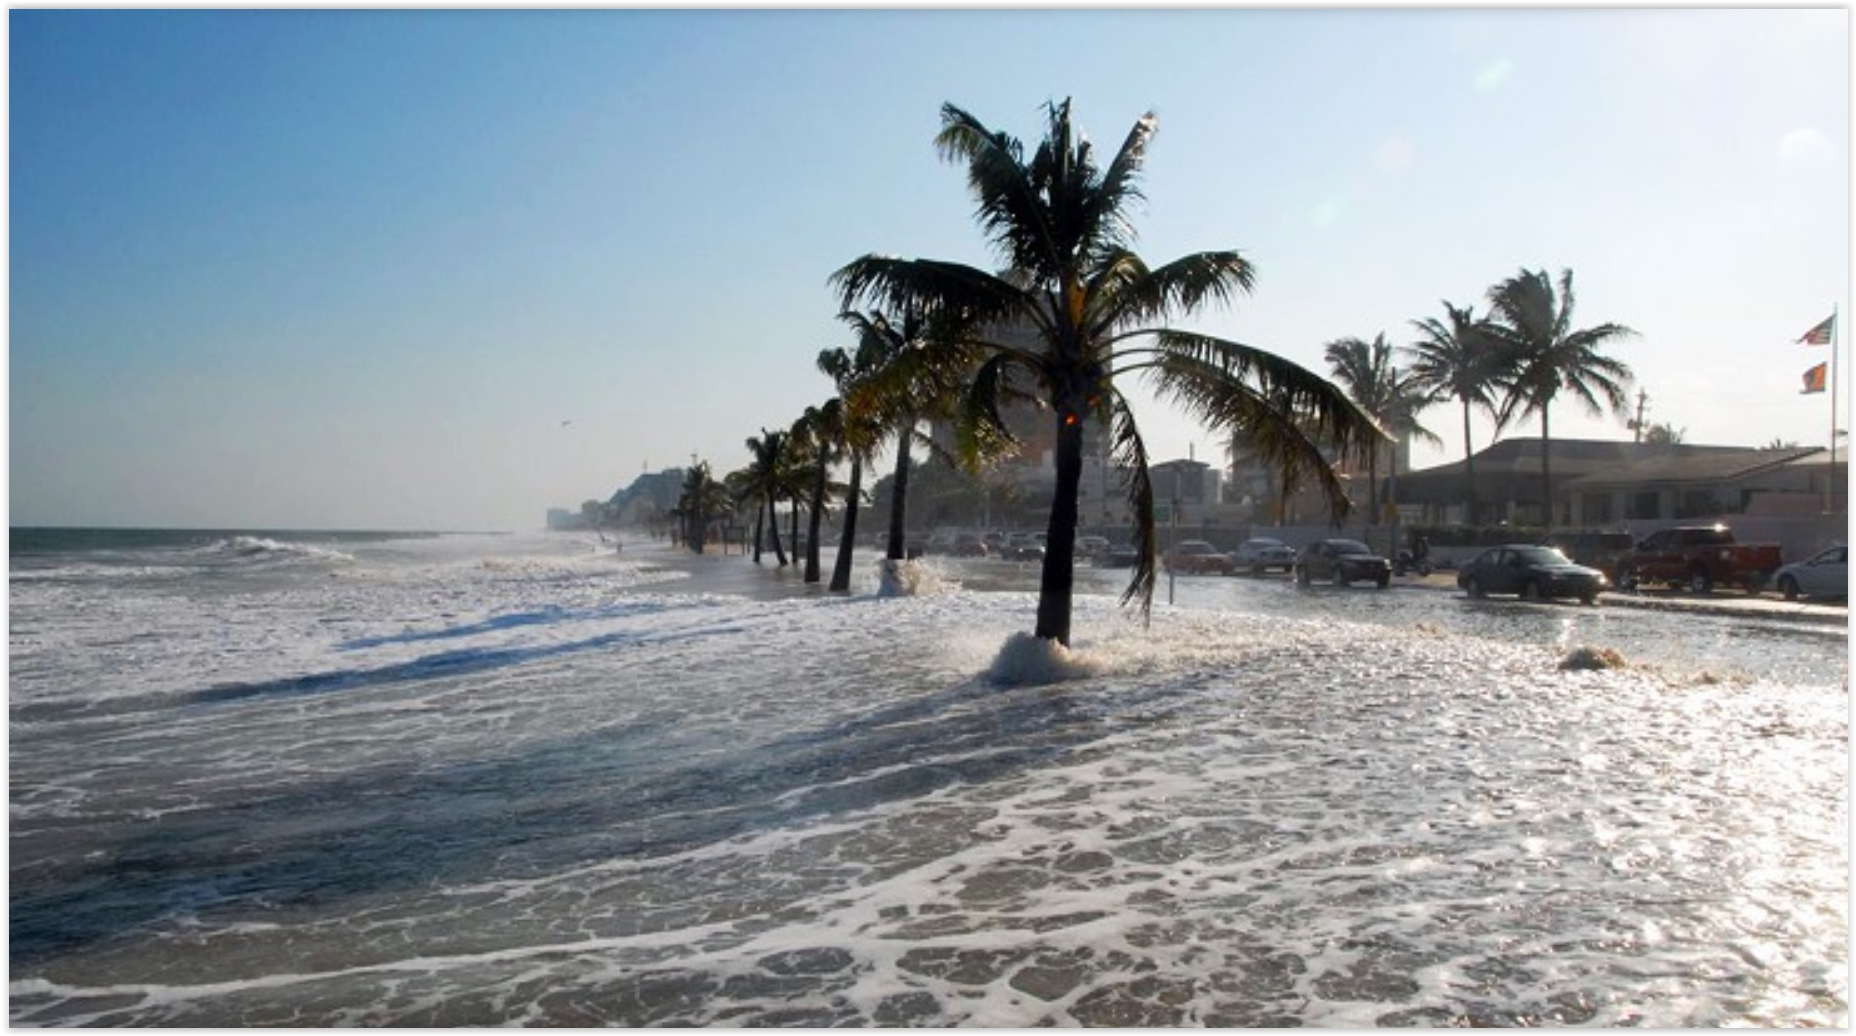
Will Rising Sea Levels Sink Property Values? Here's an excerpt from
Yahoo! Finance: "...
But
many people don’t realize that investing in waterfront property now may
lose them money, in much the same way as splurging on an expensive car
would: depreciation. The reason? Rising sea levels are eroding the
long-term value of such properties. “Once impacts become noticeable,
they’re going to be upon you quickly,” William V. Sweet, a scientist
with the National Oceanic and Atmospheric Administration in Silver
Spring, Maryland, told The New York Times.
“It’s not a hundred years off — it’s now.” Sea levels are rising,
according to scientists, due to global warming, as rising atmospheric
and ocean temperatures melt polar ice caps and glaciers. Even skeptics
of the phenomenon may find it difficult to argue with the “sharp jump in
this nuisance flooding,” currently impacting the East Coast and Gulf
Coast. Expect more flooding in those areas and the West Coast, too,
according to The Times report..."
 The History of Weather Satellites
.
AccuWeather has an interesting post - yes, we've come a long way, and GOES-R marks the next big evolutionary leap: "
The
science of weather forecasting has come a long way over the past 100
years, but one of the biggest leaps forward occurred once information
from weather satellites was readily available. Weather satellites have
had such a huge impact on weather forecasting that some divide the
history of meteorology into two categories: pre-satellite era and
post-satellite era. Weather satellites provide invaluable data to
meteorologists all around the world, not only by sending forecasters
images of weather systems but also by supplying weather models with
remote observations in places where observations cannot be taken at the
Earth's surface..."
Image credit: "
The first photo of Earth from a weather satellite, taken by TIROS-1." (Photo/
NASA)
How Wind and Solar Plan To Thrive During the Trump Presidency. Here's an excerpt from a story at
Utility Dive: "...
Our industry will be fine,” Sunnova CEO John Berger told Utility Dive. Sunnova is one of the leading national rooftop solar providers. “Business models will change and the companies that can’t deliver a better service at a better price won’t make it.”
Losing its 30% federal investment tax credit (ITC) might even provoke
constructive change, Berger said. “But with or without the ITC, this industry
will thrive and that is because we are quickly driving down the cost of
solar and solar components and now the cost of batteries is coming down
as fast...” Image credit: NAHB livestream
Biofuel From Logging Scraps Powers Alaska Airlines Jet on Cross-Country Flight. I haven't seen this before. Here's the intro to a story at The Seattle Times: "An
Alaska Airlines flight from Seattle to Washington, D.C., on Monday
morning was powered with a jet-fuel blend containing 20 percent
renewable biofuel made from Pacific Northwest forest residuals — the
limbs and branches that remain after the harvesting of managed forests.
Billed as the first commercial flight running partly on wood, the
alternative jet fuel was produced through the research efforts of the
Northwest Advanced Renewables Alliance (NARA). Led by Washington State
University, the group aims to build a sustainable supply chain for
aviation biofuel using the leavings from logging operations..."
Photo credit: "
Fueling
manager Jarid Svraka looks on as he fuels an Alaska Airlines Boeing
737-800 jet with a new, blended alternative jet fuel Monday at
Seattle-Tacoma International Airport. The fuel contains 20 percent
biofuel made from forest residuals." (Elaine Thompson/AP).
 It's Hard To Tell Whether Trump Supports Renewable Energy - And That May Not Matter Much. Here's an excerpt from a post at FiveThirtyEight: "...Job creation is a key part of bolstering that capital. Just over 600,000 Americans are employed in industries related to alternative energy
— not including the 1.9 million employed in the energy efficiency
industry, which is aimed at reducing the amount of energy people have to
use for services like transportation, or home heating and cooling. The
solar and wind industries account for about 61 percent of those jobs.
There are far more people employed in all the industries related to
fossil fuels, 3.6 million in the U.S. in total. But 600,000 jobs is a
big deal to the American economy
It's Hard To Tell Whether Trump Supports Renewable Energy - And That May Not Matter Much. Here's an excerpt from a post at FiveThirtyEight: "...Job creation is a key part of bolstering that capital. Just over 600,000 Americans are employed in industries related to alternative energy
— not including the 1.9 million employed in the energy efficiency
industry, which is aimed at reducing the amount of energy people have to
use for services like transportation, or home heating and cooling. The
solar and wind industries account for about 61 percent of those jobs.
There are far more people employed in all the industries related to
fossil fuels, 3.6 million in the U.S. in total. But 600,000 jobs is a
big deal to the American economy..."
These 6 New Technology Rules Will Govern Our Future. Here's a clip from a story at The Washington Post that got my full attention: "...In
every field, machines and robots are beginning to do the work of
humans. We saw this first happen in the Industrial Revolution, when
manual production moved into factories and many millions lost their
livelihoods. New jobs were created, but it was a terrifying time, and
there was a significant societal dislocation (from which the Luddite
movement emerged). The movement to digitize jobs
is well underway in low-salary service industries. Amazon relies on
robots to do a significant chunk of its warehouse work. Safeway and Home
Depot are rapidly increasing their use of self-service checkouts. Soon,
self-driving cars will eliminate millions of driving jobs. We are also
seeing law jobs disappear as computer programs specializing in discovery
eliminate the needs for legions of associates to sift through paper and
digital documents..."
 A Brief History of the Cheese Curl, Junk Food's Happiest Accident
.
Atlas Obscura has an article that will make you hungry, for orange-colored food - here's a clip: "
They
change the color of our skin. They get stuck in our teeth. But for some
reason, we can’t stop eating cheese curls, the puffiest snack food ever
created. But these corn-and-powder snacks didn’t just fall like manna
from the sky into our bowls, always there for us ahead of our Bojack
Horseman marathon. The story of the cheese curl is one of the more
unusual creation stories in snack-food history, starting, of course,
in Wisconsin, an agricultural hub that has given us a lot of food
innovations over the years.."
 TODAY
TODAY: Mostly cloudy skies. Winds: NE 7-12. High: 55
THURSDAY NIGHT: Cloudy, chance of a little rain or drizzle. Low: 46
FRIDAY: Winter Storm Watch. Rain changes to snow. Blizzard conditions western MN. 2-4" possible St. Cloud area; much more west of STC. Winds: NW 20-40. High: 43, falling rapidly
SATURDAY: Slow clearing, cold wind. Winds: NW 10-20. Wake-up: 29. High: 36
SUNDAY: Partly sunny with less wind. Winds: SE 8-13. Wake-up: 23. High: 38
MONDAY: Mix of clouds and sun, quiet weather. Winds: SE 7-12. Wake-up: 26. High: 43
TUESDAY: Light rain or mix arrives late. Winds: SE 7-12. Wake-up: 33. High: 42
WEDNESDAY: Damp start, then gradual clearing. Winds: W 5-10. Wake-up: 32. High: 43
Climate Stories
WMO: Past 5 Years Hottest on Record, Worldwide. Here's an excerpt from a story at
Fusion: "...
On
November 8, the World Meteorological Organization (WMO) delivered a
report at the international conference on climate change in Morocco
(COP22) which was called in order to carry forward the Paris agreement
of COP21. The WMO reported that the past five years were the hottest on record.
It reported rising sea levels, soon to increase as a result of the
unexpectedly rapid melting of polar ice, most ominously the huge
Antarctic glaciers. Already, Arctic sea ice over the past five years is
28% below the average of the previous 29 years, not only raising sea
levels, but also reducing the cooling effect of polar ice reflection of
solar rays, thereby accelerating the grim effects of global warming..." (Image: NASA).
Military Leaders Urge Trump To See Climate As a Security Threat. Scientific American has the story; here's an excerpt: "...
The
Center for Climate & Security in its briefing book argues that
climate change presents a risk to U.S. national security and
international security, and that the United States should advance a
comprehensive policy for addressing the risk. The recommendations,
released earlier this year, were developed by the Climate and Security
Advisory Group, a voluntary, nonpartisan group of 43 U.S.-based senior
military, national security, homeland security and intelligence experts,
including the former commanders of the U.S. Pacific and Central
commands. The briefing book argues that climate change presents a
significant and direct risk to U.S. military readiness, operations and
strategy, and military leaders say it should transcend politics. It goes
beyond protecting military bases from sea-level rise, the military
advisers say. They urge Trump to order the Pentagon to game out
catastrophic climate scenarios, track trends in climate impacts and
collaborate with civilian communities..." (File photo: AP).
Military, Security Leaders Deliver Climate Change Briefing Book to President-Elect. Here's the intro to an update from
The Center for Climate and Security: "
In the wake of last week’s election, the Center for Climate and Security is delivering a Briefing Book for a New Administration to the President-elect. The book of recommendations was developed by the Climate and Security Advisory Group (CSAG),
a voluntary, non-partisan group of 43 U.S.-based senior military,
national security, homeland security, and intelligence experts,
including the former Commanders of U.S. Pacific and Central Command, and
former Special Assistant to President Reagan for National Security
Affairs. Climate change presents risks that must be managed, no matter
one’s political perspective..."
 DC Prepares For Heat Emergencies To Nearly Double by 2020, Among Other Climate Change Effects
. Here's a clip from
DCist: "...
D.C.
currently experiences around 11 heat emergency days per year, which
could almost double to 20 days by 2020 and spike up to 75 days by 2080,
according to the report. Washingtonians should also expect much warmer
average temperatures; longer, hotter, and more frequent heat waves; and
more frequent and intense heavy rain and flooding. The city has already begun to see record-breaking heat waves
and snowstorms as well as flooding caused by rising sea levels and high
rainfall. Climate Ready DC, the city's readiness plan, looks at current
weather patterns and predicts how they will change by 2080. The report,
which was developed by consulting with experts inside and outside of
District government, then outlines the city's strategies to adapt..." Photo credit:
SweetJen34
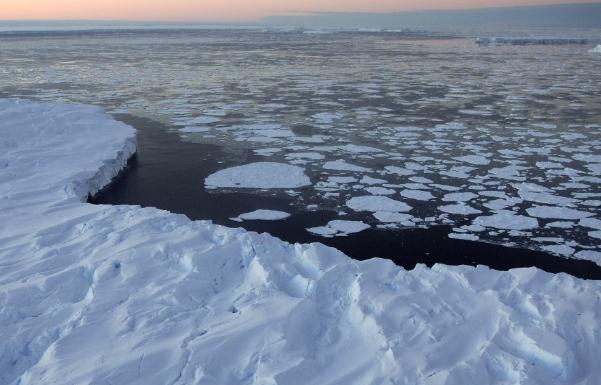
The End of Ice. Check out the photo essay at
New Republic: "...
The peculiar physics of climate change have played a particularly nasty trick on those who live farthest to
the north. The steady, relentless stream of data from satellites,
weather buoys, and remote weather stations makes it clear that the
Arctic—which has supported human life for millennia—is warming twice as fast as any place on the planet. But you don’t need data to understand what’s happening: Pictures will do..."
40 Years of Measuring the World's Cleanest Air Reveals Human Fingerprints on the Atmosphere. Here's an excerpt from
The Conversation: "...
Cape Grim data are freely available and have been widely used in all five international climate change assessments (1990-2013), all ten international ozone depletion assessments (1985-2014), in four State of the Climate Reports 2010-2016 and in lower-atmosphere ozone assessments.
Measurements at Cape Grim have demonstrated the impact of human
activity on the atmosphere. For example, CO₂ has increased from about
330 parts per million (ppm) in 1976 to more than 400 ppm today, an
average increase of 1.9 ppm per year since 1976. Since 2010 the rate has
been 2.3 ppm per year. The isotopic ratios of CO₂ measured at Cape Grim
have changed in a way that is consistent with fossil fuels being the
source of higher concentrations..."
Graphic credit: "
Cape Grim has documented the increase in atmospheric CO2 concentrations." CSIRO/Bureau of Meteorology, Author provided.
Why Arctic Waters Are Reluctant to Freeze. The Guardian explains: "...
Much
of the reason for these warm temperatures and the sluggish rate of
sea-ice formation is the exceptional summer sea-ice melt that occurred
this year. By 10 September the National Snow and Ice Data Center
reported that Arctic sea-ice had shrunk to an area of just 4.14m square
kilometres – tying with 2007 for second lowest sea-ice extent on
record, and some 740,000 square kilometres short of the record set in
2012..."


ReplyDeleteIt’s an eye-opener and interesting! Renewable Jet Fuel is a Energy" production company offering organic, cellulose, commercial scale, ASTM compliant designer Biofuel Plane in Washington State Volume wood biomass supplies from local feedstock suppliers.
You run out of time! Save time, maximize your assets, and get the Renewable Jet Fuel!